The first evidence of the massive amount of energy produced by supernovas in a neutrino burst came in 1989 when both the Kamiokande and the IMB detected the resulting neutrinos.
In 1989 the Kamiokande team confirmed Ray Davis’s 1968 results, that the flux of neutrinos from the Sun was indeed much lower than expected by approximately a third. At the same time a number of other things were happening. The NUSEX experiments and the Fréjus detector (located near the center of the Frejus tunnel in France) which were two much smaller installations using iron instead of water, reported no deficit in muon-neutrino interactions.
The present study is based on a sample of 407 775 single muons and 12 559 muon bundles with zenith angles smaller than 60°, observed in the 12.3m×6m×6m Fréjus proton-decay detector, at a depth of 4850 hg/cm2. The variation of the vertical muon intensity with depth is given. Using a maximum-likelihood method, the muon lateral distribution of underground bundles is investigated as a function of muon multiplicity and zenith angle. The same method yields the true multiplicity distribution at the site depth, corrected for all detection effects.
–Fréjus Collaboration
In 1989 the number of types (or flavors) of neutrinos was measured in a particle detector in the european center of nuclear research (CERN), measuring particles created by the Large Electron Positron collider (LEP) and in the Stanford Linear Accelerator Center (SLAC). In these accelerators an electron and a positron collided in the right energy to produce the Z boson. The study of the Z boson lifetime allowed us to show that only three light neutrino families exist. This was a major physics result! The more particles the Z boson can decay to, the shorter its lifetime is. The shorter the lifetime of a particle, the more undetermined its mass. One says that its mass distribution has a width and this width increases with the number of possibilities for the particle to decay.
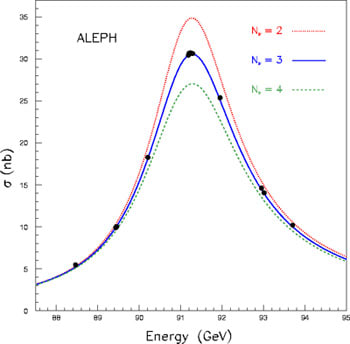
In the above plot the points represent the measured mass distribution of the Boson. The red line is the predicted distribution assuming 2 neutrino flavors exist, The blue curve assumes exactly 3 neutrino types exist, and the green line is for 4 types of neutrinos. As you can can clearly see, that the best agreement of the measured values (black markers) is with the blue line, meaning there are 3 types of light neutrinos.