Figure 4.1: Likelihood ratio for data and atmospheric MC, 2000-2006 (Zeuthen+purity cuts)
John Kelley, UW-Madison, May 2008
For this analysis we use muon-DAQ data of AMANDA-II from the years 2000 to 2006. 2000-2003 and 2004 data were processed in Zeuthen, while 2005 and 2006 data were processed in Madison. The filtering for 2005-2006 is quite similar to the Zeuthen filtering, the main differences being the crosstalk cleaning and the details of the L3 zenith cut.
For the selection of a high-quality atmospheric muon neutrino sample, we have started with the Zeuthen point-source cuts. We investigated other methods optimizing for atmospheric neutrino selection, but returned to this sample for several reasons:
The remaining 3% background contamination could still be an issue if it is distributed non-uniformly in our observables (Nch and cos(Zenith)), so we have applied an additional set of purity cuts to increase the purity to >99%.
The following table shows the livetime for each year, the number of events surviving to L3 in the upward-going muon (UpMu) stream, and the final number of neutrino events below the horizon after Zeuthen + purity cuts:
| Year | Livetime | L3 UpMu Events | Final Upgoing Events |
| 2000 | 197 d | 1.63 M | 516 |
| 2001 | 193 d | 1.90 M | 750 |
| 2002 | 204 d | 2.10 M | 908 |
| 2003 | 213 d | 2.22 M | 966 |
| 2004 | 194 d | 2.09 M | 901 |
| 2005 | 199.26 d | 5.21 M | 810 |
| 2006 | 186.95 d | 4.89 M | 835 |
| Total | 1387.21 d | 20.04 M | 5686 |
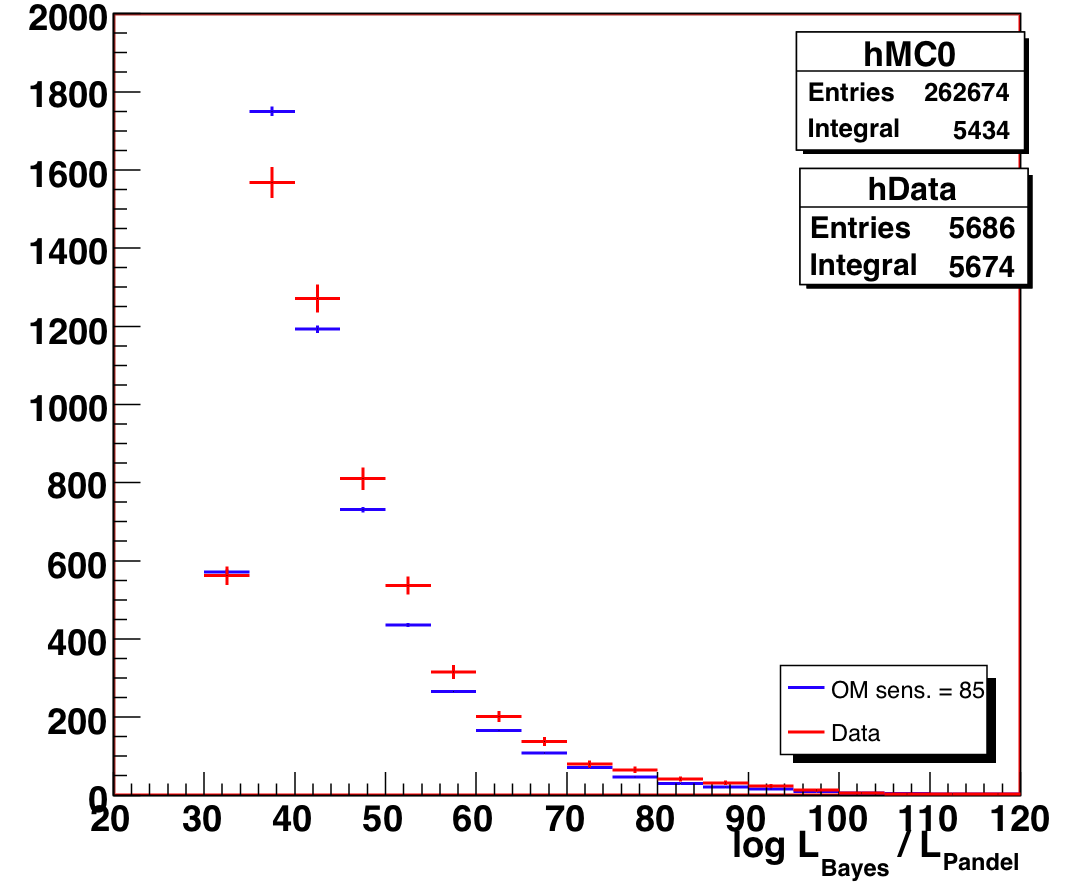
The following figures show data/MC agreement for the all of the track quality variables used in the cuts (below the horizon, all Nch). Reconstructed zenith and Nch were removed from the data files for blindness.
Figure 4.1: Likelihood ratio for data and atmospheric MC, 2000-2006 (Zeuthen+purity cuts)
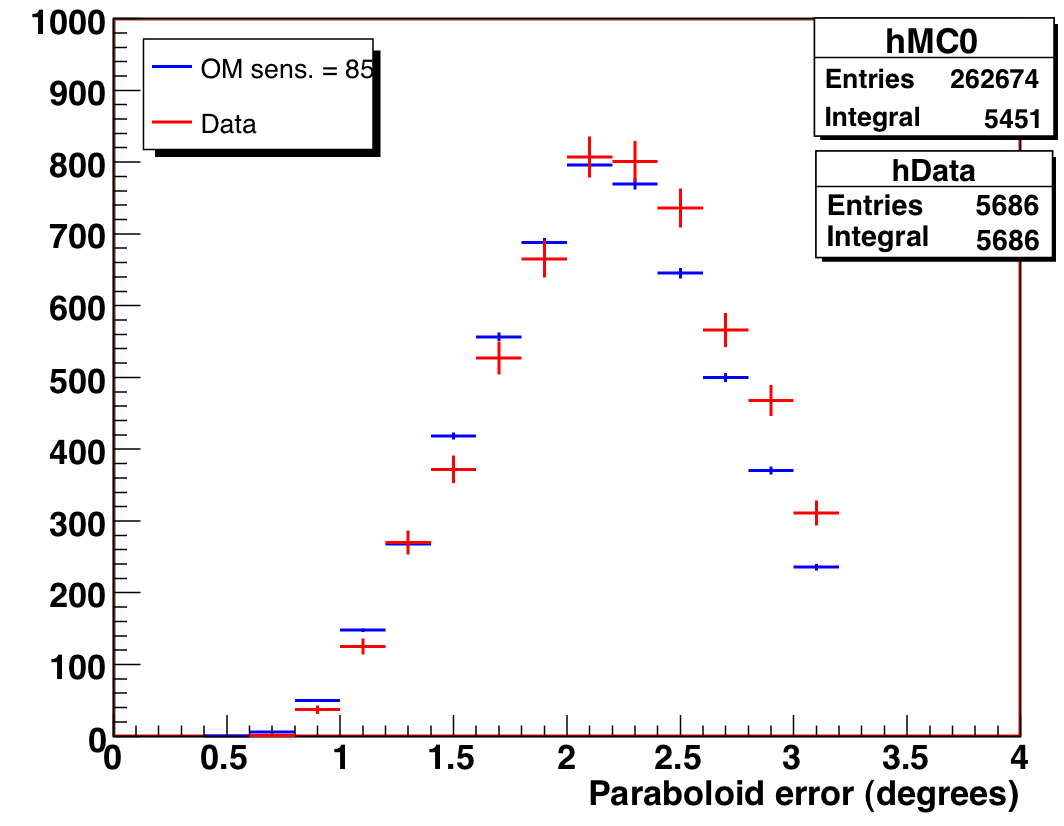
Figure 4.2: Paraboloid error for data and atmospheric MC, 2000-2006 (Zeuthen+purity cuts)
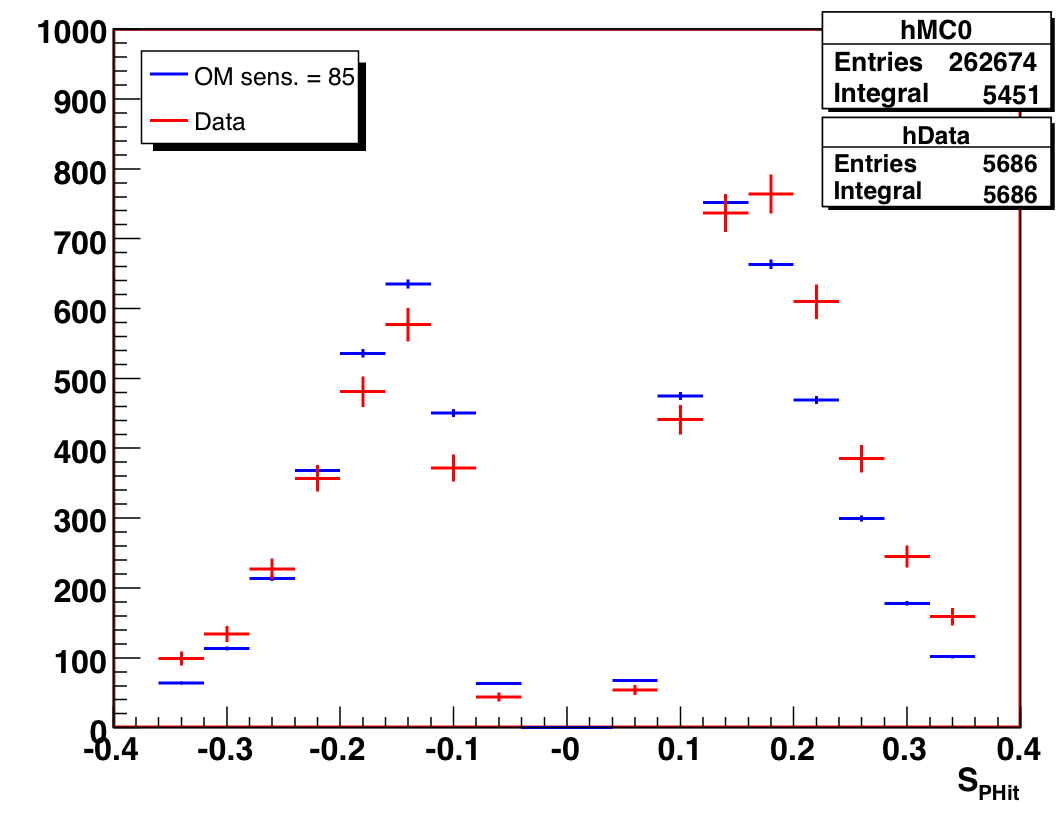
Figure 4.3: Smoothness for data and atmospheric MC, 2000-2006 (Zeuthen+purity cuts)
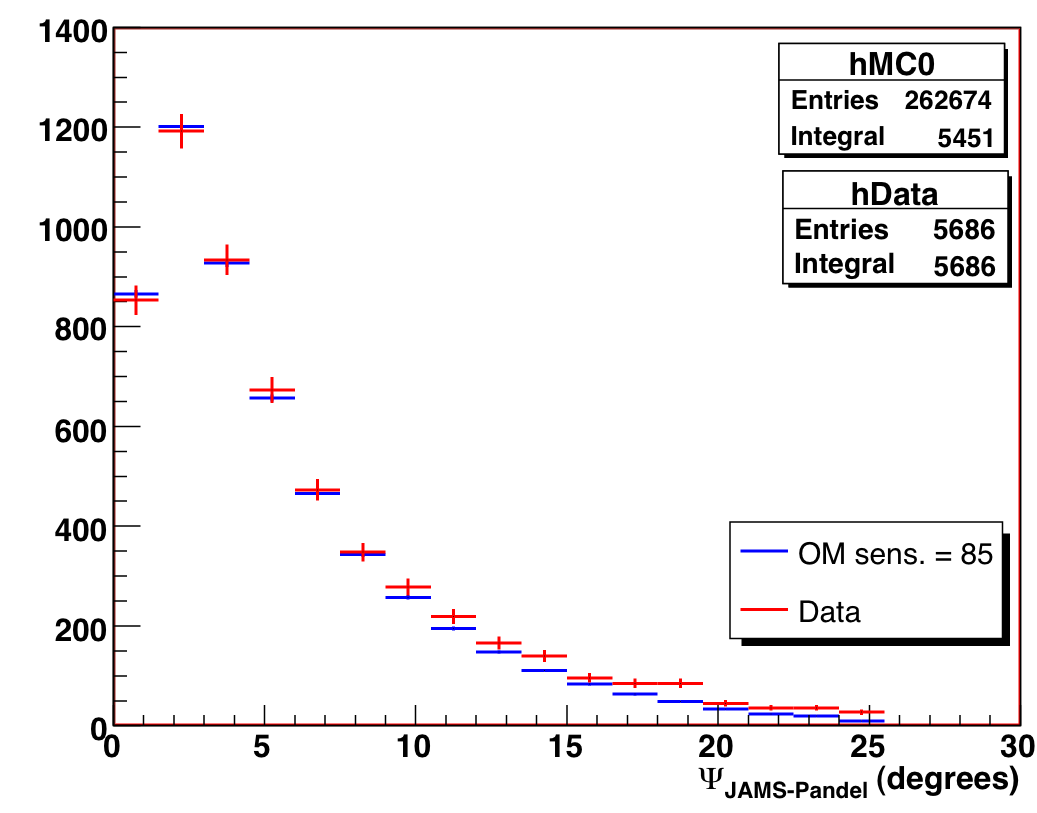
Figure 4.4: JAMS-Pandel space angle difference for data and atmospheric MC, 2000-2006 (Zeuthen+purity cuts)
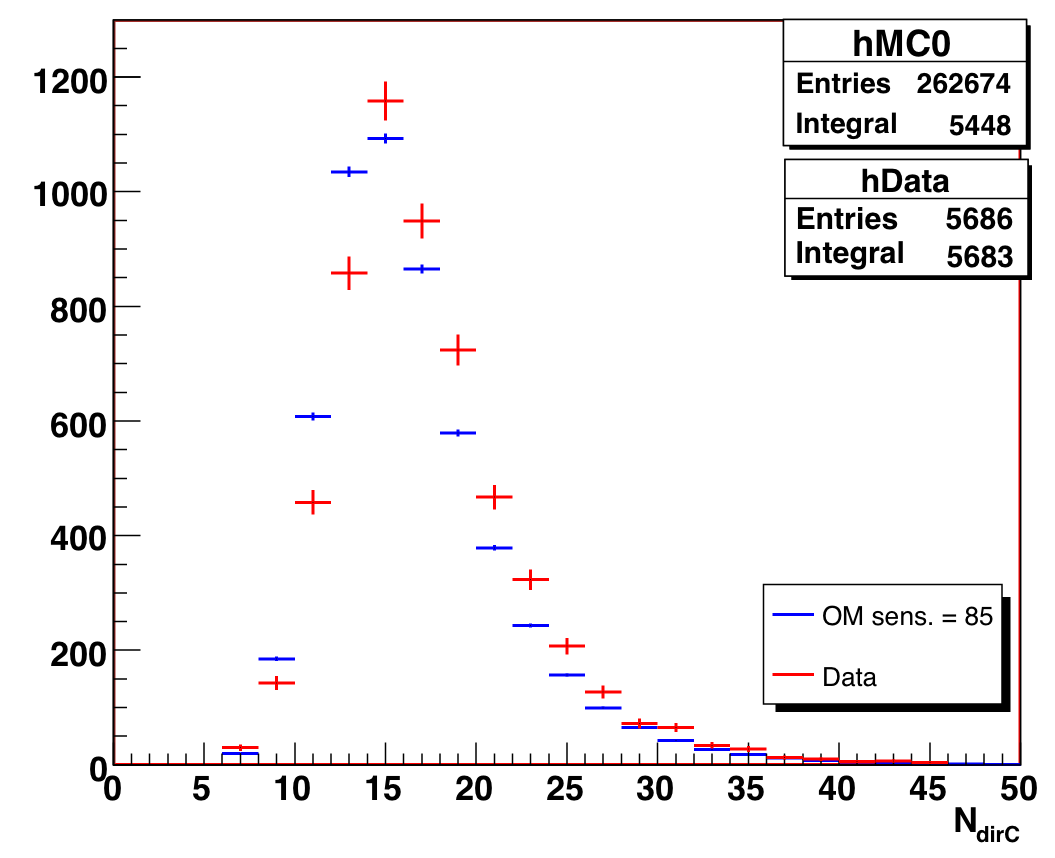
Figure 4.5: Number of direct hits for data and atmospheric MC, 2000-2006 (Zeuthen+purity cuts)
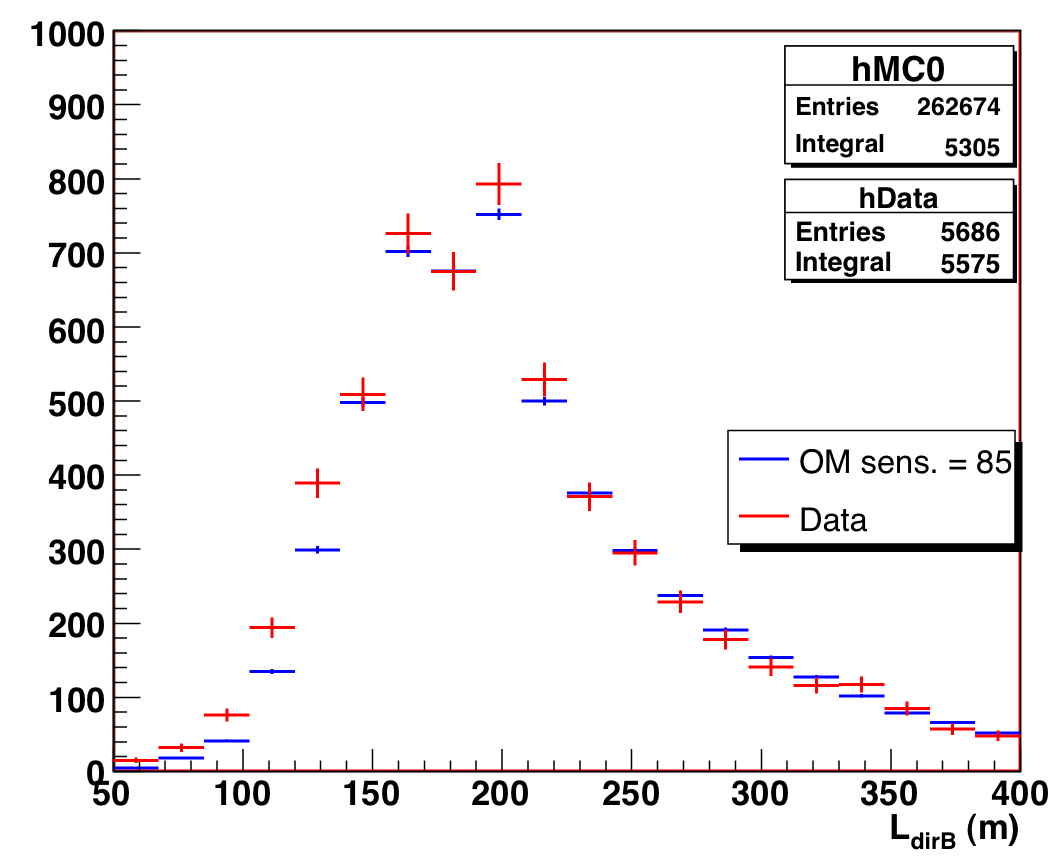
Figure 4.6: Direct length for data and atmospheric MC, 2000-2006 (Zeuthen+purity cuts)
Details on the OM sensitivity and why we have used 85% above are discussed in the systematic error section later in this proposal.
Other analyses have found that the background contamination at the Zeuthen cut level is O(5%), and it is likely concentrated non-uniformly above Nch > 60 (we have intentionally not confirmed this because of blindness). However, we can examine the purity using a cut-tightening ratio procedure, and then try to isolate these remaining events.
The following figure shows the result of this procedure. First, we uniformly tighten / loosen all the cut parameters by linearly scaling them with a "cut strength" parameter: that is, we multiply the observable x by either alpha or 1/alpha depending on the cut:
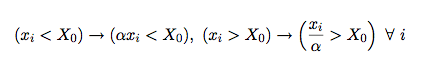
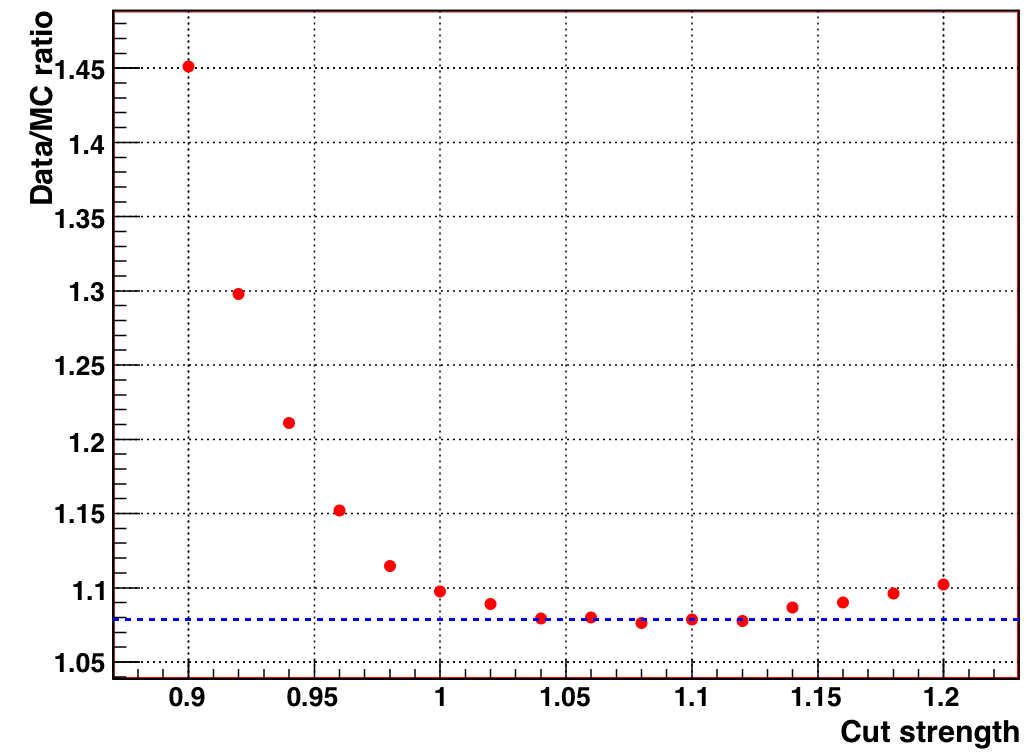
Figure 4.7: Data/MC ratio as a function of cut strength (1 = Zeuthen cuts). The dashed line indicates the average of the flat region.
We have isolated several parameters which are of use to reduce this background even further: Psi, the space angle between the Pandel and JAMS fits; Ldirb, direct length; and Ndirc, number of direct hits. All show tails in the data that are not matched by atmospheric neutrino MC but that are consistent with misreconstructed muons (see the following figures).
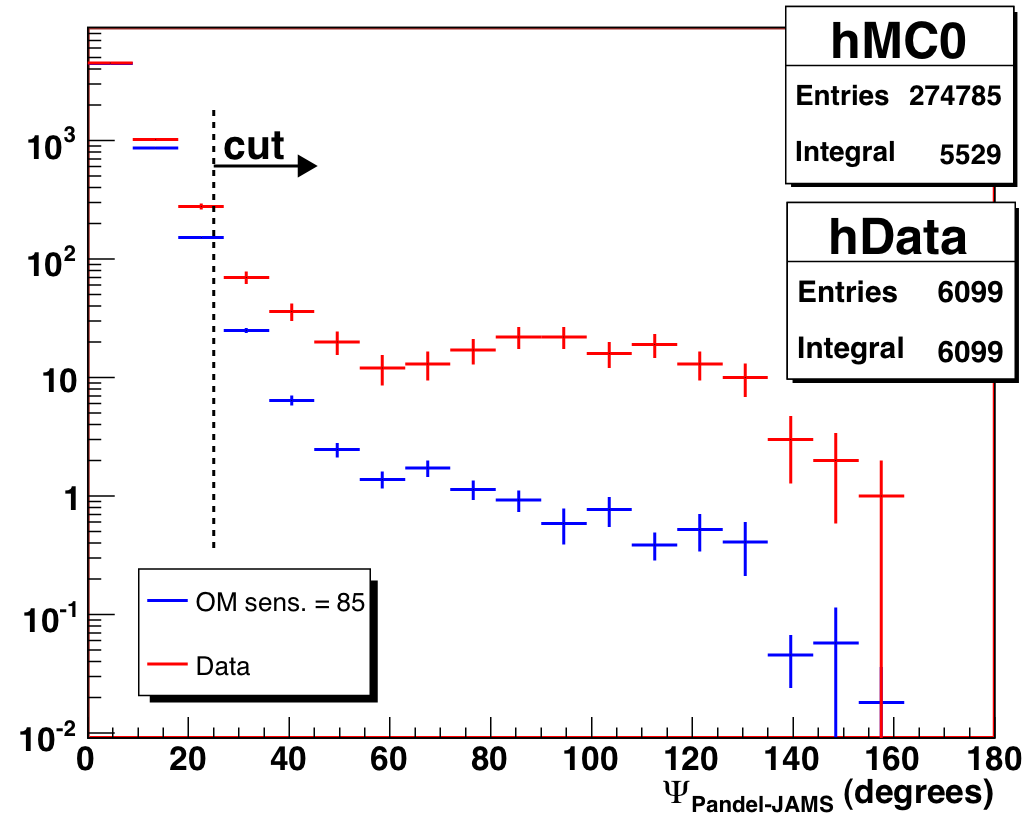
Figure 4.8: Space angle between Pandel and JAMS reconstructions for data and atmospheric MC, 2000-2006 (Zeuthen cuts only)
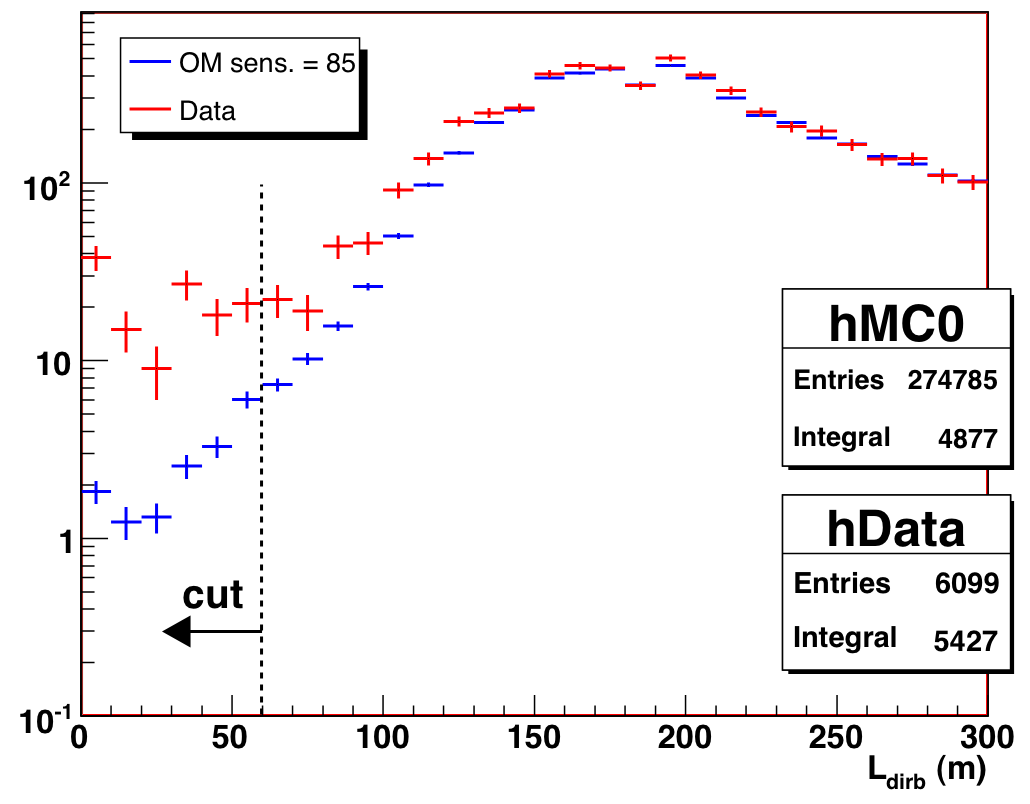
Figure 4.9: Direct length B (-15ns < residuals < 25ns) for data and atmospheric MC, 2000-2006 (Zeuthen cuts only) |
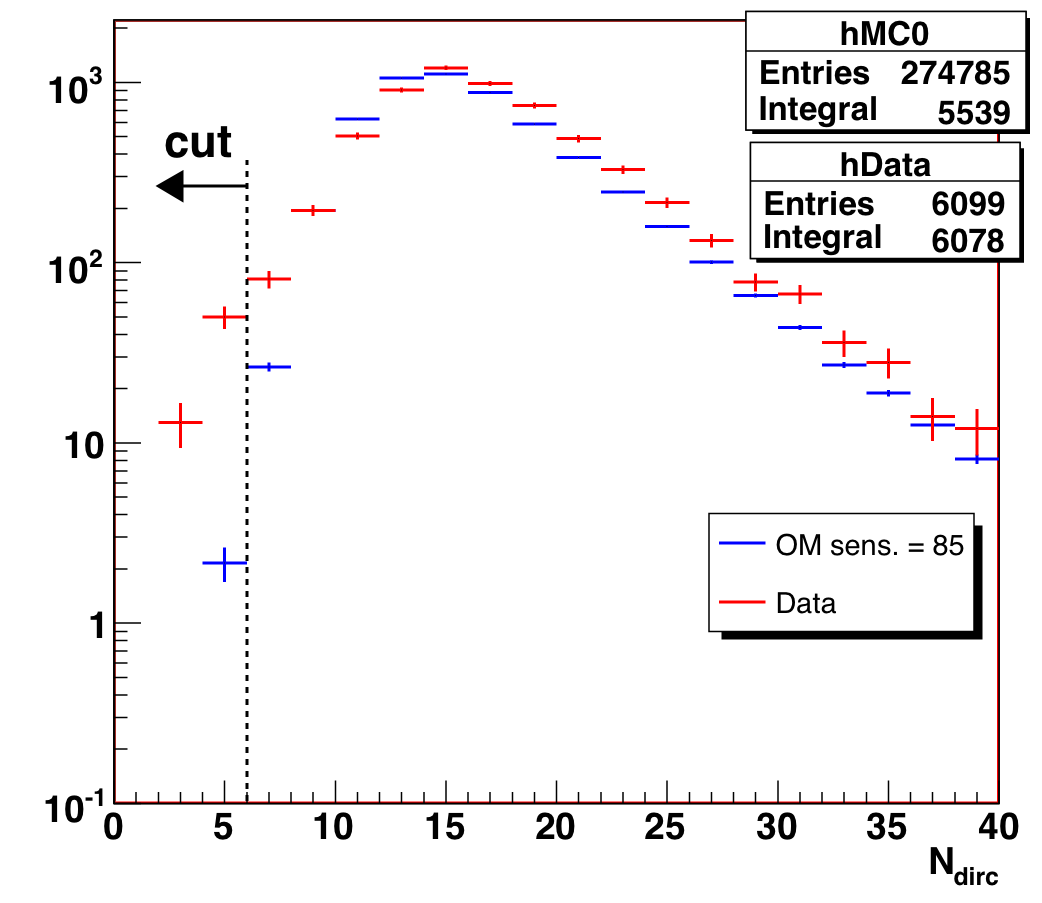
Figure 4.10: Number of direct hits C (-15ns < residuals < 75ns) for data and atmospheric MC, 2000-2006 (Zeuthen cuts only) |
We find that the cuts (Psi < 25) && (Ldirb > 60) && (Ndirc > 6) achieve a purity of greater than 99%, as shown in the revised data/MC ratio plot below. This reduces the data from 6099 to 5686 events (-7%) while reducing the atmospheric neutrino MC prediction by 2%.
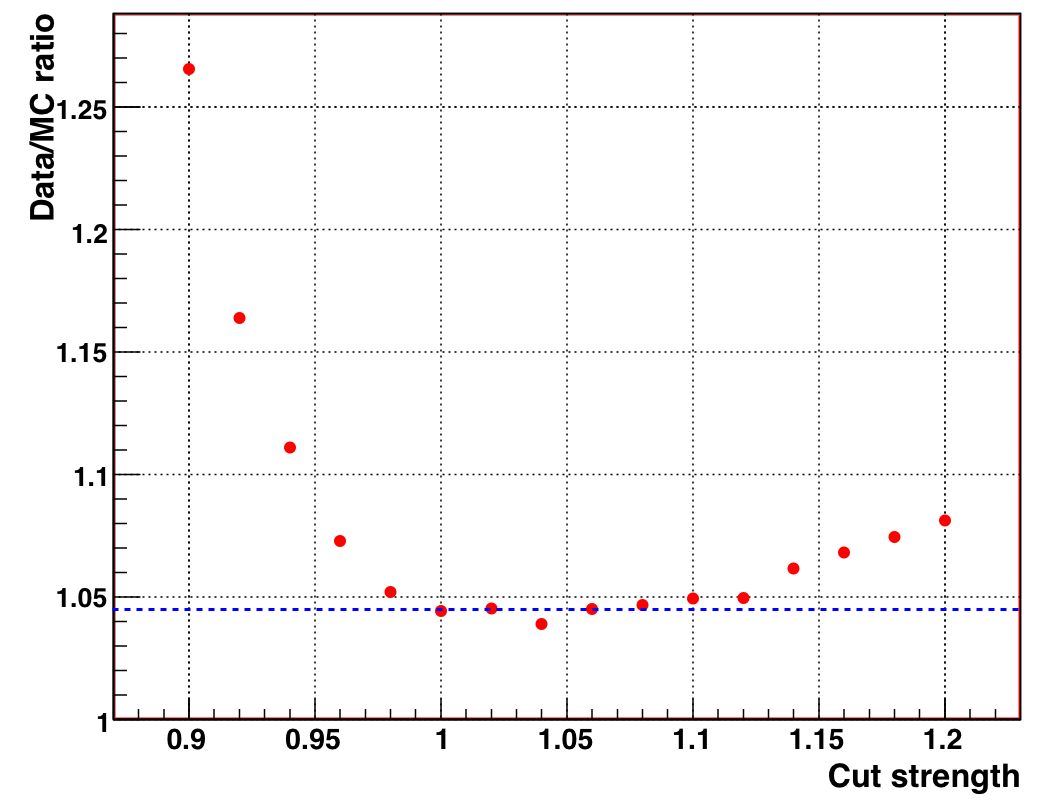
Figure 4.11: Data/MC ratio as a function of cut strength (1 = Zeuthen + purity cuts) in the analysis region. The dashed line represents the average of the flat region. The difference between the nominal cut level and the minimum is 0.5%.
As a final check we exhibit the smoothness for the events that are removed by the purity cuts:
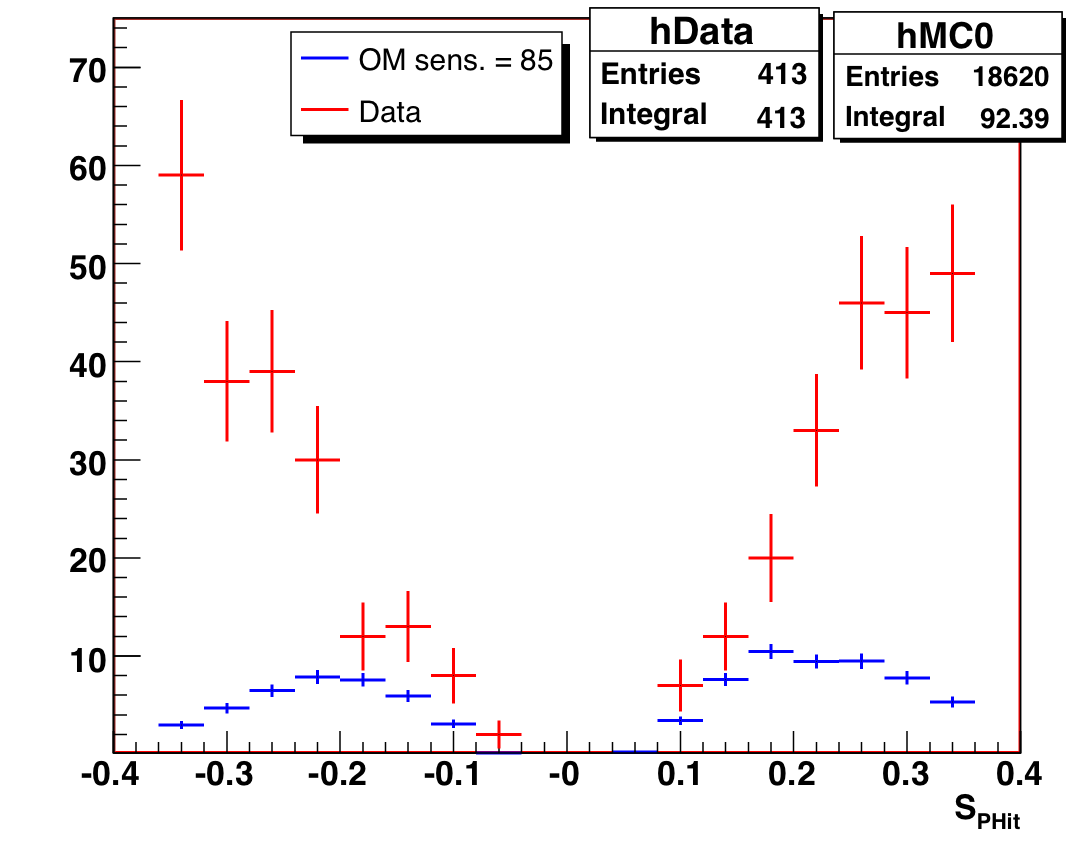
Figure 4.12: Smoothness of the events present after the Zeuthen cuts but removed by the purity cuts.
| Likelihood ratio | Jkchi[bayes64] - Jkchi[pandel] > (34 + 25 * (1
- Theta(x-0.15)) * (x-0.15)) |
| Smoothness | (abs(S_phit[pandel]) < 0.36) && (S_phit[pandel] != 0) |
| Paraboloid fit error | 2000-2004: (180 / PI * (P08err1 * P08err2)^(0.25) < 3.2 - 4 * Theta(x-0.75) * (x-0.75)) && (P08err1 >= 0) && (P08err2 >= 0) 2005-2006: (180 / PI * (P08err1 * P08err2)^(0.5) < 3.2 - 4 * Theta(x-0.75) * (x-0.75)) && (P08err1 >= 0) && (P08err2 >= 0) |
| Flare variables | 2000-2004: Flrshrtm + Flrndcb1 + Flrndc11 < 10 2005-2006: Shortm_6 + Indcb108 + Indc1119 < 10 |
| Stability period | 2000: (Gpsday >= 47) && (Gpsday <= 309) 2001: (Gpsday >= 44) && (Gpsday <= 293) 2002: (Gpsday >= 43) && (Gpsday <= 323) 2003: (Gpsday >= 43) && (Gpsday <= 315) 2004: (Gpsday >= 43) && (Gpsday <= 309) 2005-2006: included in good file selection |
| Bayesian Sieglinde bug fix |
2005-2006: Zenith[bayes64] < 90 |