Atmospheric Neutrino Unblinding Proposal
AMANDA-II 2000-2006
John Kelley, UW-Madison, May 2008
9. Results
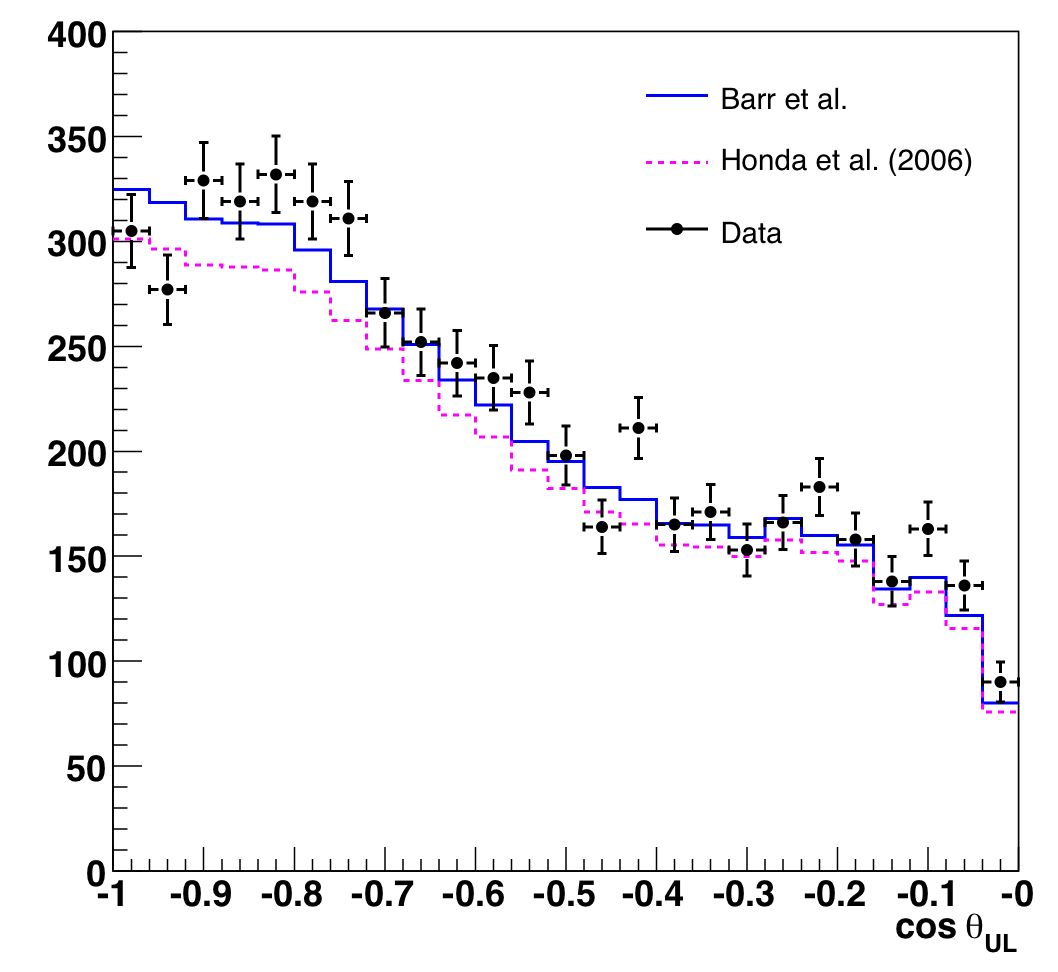
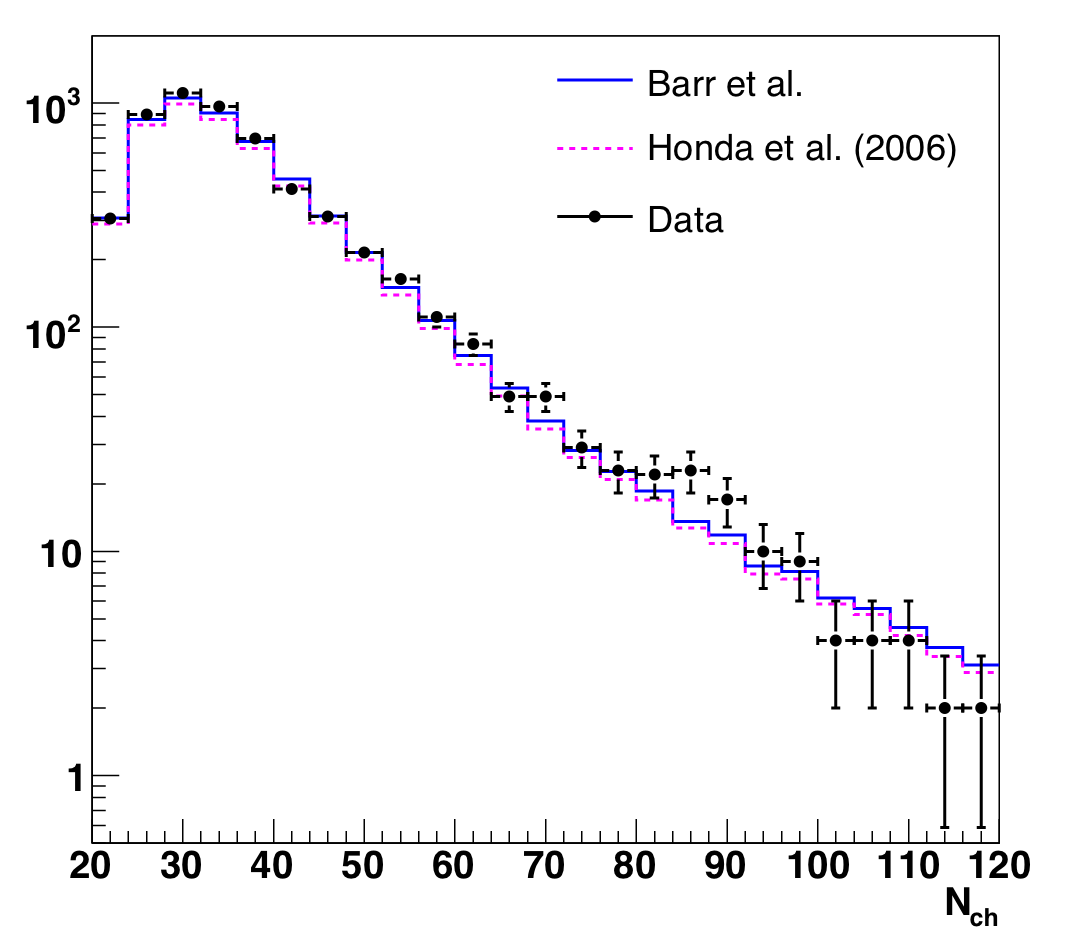
Observables
After applying the Nch-dependent cuts described in the previous section, we
revisit the observable distributions, Nch and cos(Zenith). We
note that these plots are binned more finely than in the likelihood
analysis, and we have not normalized MC to data.
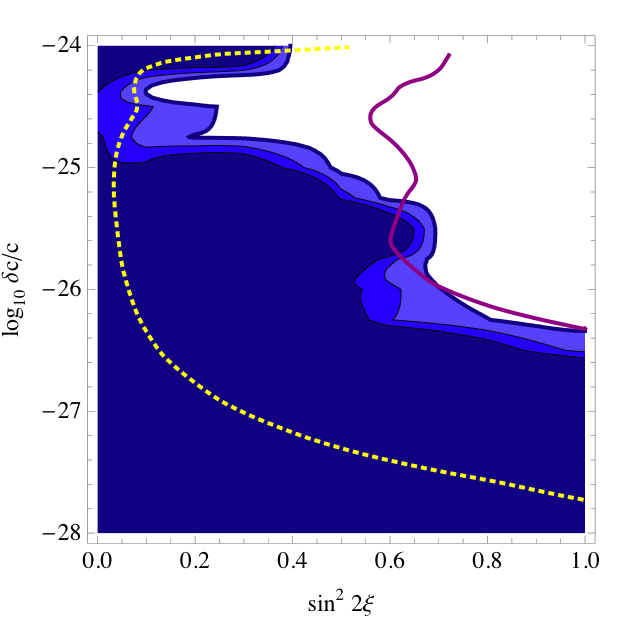
Limits on VLI and Quantum Decoherence
The new limits on VLI are presented in figure 9.3. The upper limit at
maximal mixing (2.8e-27) is slightly worse, as expected, than the limit calculated
after the first unblinding, and it is no longer better than the SuperK+K2K
limit. However, it is still a 40% improvement on the previous AMANDA-II
limit.
We have also calculated the upper limits for similar VLI and QD models using
different energy dependences. The expectation for a signal does not
appreciably change -- only the
steepness of the new physics transition. We present VLI and QD limits
in the table below for effects proportional to E, E^2, and E^3. VLI upper limits
are for maximal mixing; QD upper limits are for all decoherence parameters
equal. Numbers in bold are the models shown above in the 2D contour plots.
| n |
VLI limit |
QD limit |
Units |
| 1 |
2.8e-27 |
1.2e-27 |
-- |
| 2 |
2.7e-31 |
1.3e-31 |
1/GeV |
| 3 |
1.9e-35 |
6.3e-36 |
1/GeV^2 |
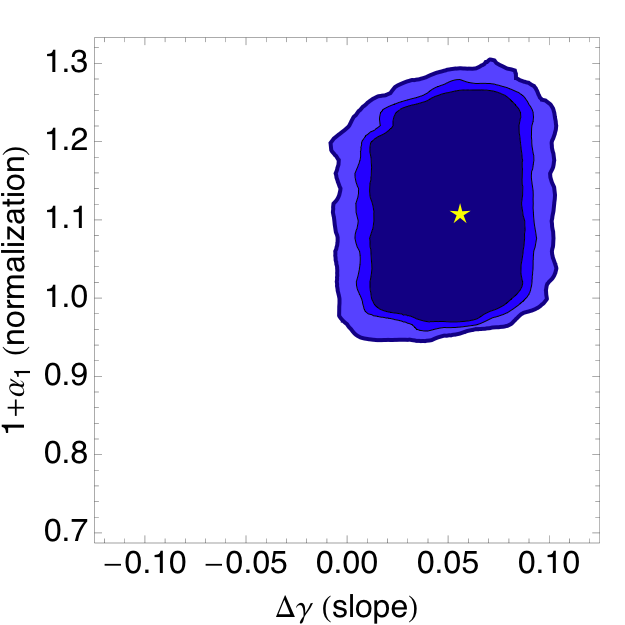
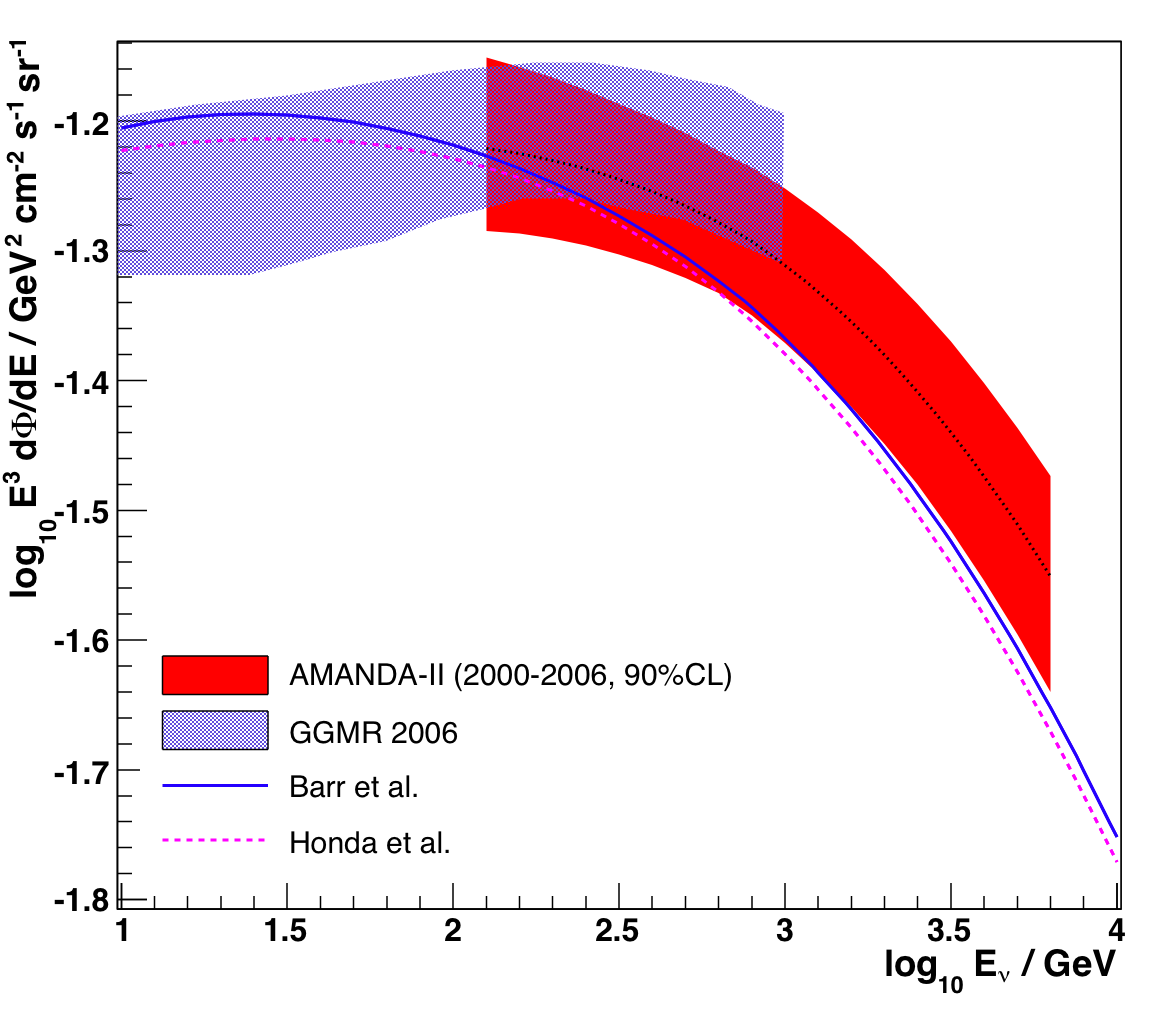
Constraints on the Conventional Flux
The two-parameter unfolding (or "forward folding") results for the conventional atmospheric flux
are presented below. The contours suggest an atmospheric flux that has a slightly
higher normalization and spectral slope than the Bartol model (although we
do note the latter is extrapolated via NeutrinoFlux past 700 GeV). We are
currently checking the results based on the Honda 2006 model to make sure
they are comparable.
The 90% contour can be represented as an allowed band of possible fluxes --
the envelope of curves generated by the different allowed normalizations and
spectral slopes. The energy region for the band is the intersection of the
5-95% regions for each particular possibility.
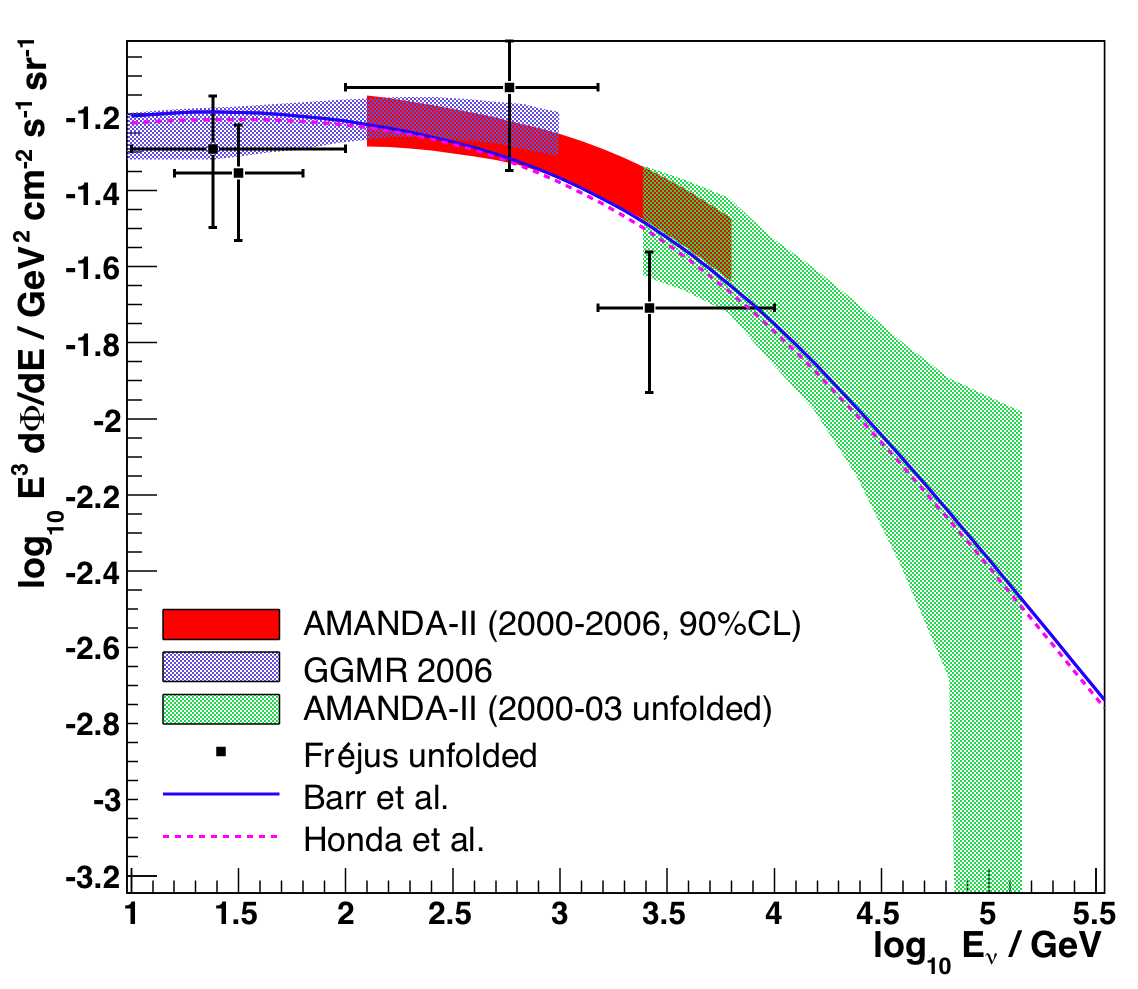
Finally, we show a comparison of this result with the 2000-03 Münich et
al. unfolding result. The energy ranges are complementary, and the
agreement in the overlap region is rather good. The data points
describing the 90% allowed forward-folding flux can be found
here.