Welcome to the llh-map gallery!
llh-map is a new gulliver module which maps out the likelihood over all of azimuth and declination for an event.
To accomplish this, the module fixes the direction of a seed track, reoptimizes the vertex of this track (important for numerical minimization) and then re-fits the vertex.
This procedure gives the likelihood for a track coming from that particular direction in the sky (in the approximation that the likelihood is ~gaussian in vertex space).
Repeating this procedure on a grid over the whole sky returns a likelihood map or landscape for that particular event.
Eventually, I would like to release it, but it will not be ready for some weeks.
The time it takes to map the whole sky for an event depends strongly on nchan, but averages around 20-25 (nugen E^-1) or 10-15 (corsika unweighted) minutes for a 1deg x 1deg map (~100000 vertex minimizations or sampling points).
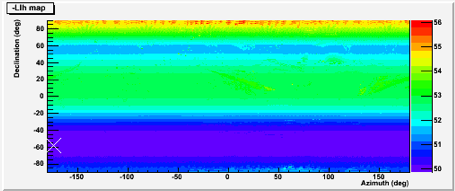
The z-axis (color) represents -1*LogLikelihood (unreduced), so smaller is better.
It's very important to note that purple means the event was highly likely to come from this direction and red means it was highly unlikely. You'll see in most plots that the opposite direction to the purple minimum (best) is a red spot (bad).
To get a feel for these maps, a few pathological events are given below, but to see lots of these maps (in a new, shinier format), skip to the galleries (more coming).
Usage:
You can check out the project from svn:
offline v1
http://code.icecube.wisc.edu/svn/sandbox/jdumm/llh-map/branches/V01-00-00b/
ofline v2
http://code.icecube.wisc.edu/svn/sandbox/jdumm/llh-map/branches/V02-00-00/
In the resources/scripts folder you will find llh_map_basic_b.py, which you can run over an i3 file.
This will write the llh-map to the frame which can be written to a new i3 file and it will also write a .txt file for each event (I3DumpLLHMapToTxt module).
You can then run the visualize_llh_map.C root script to get an image like those in the gallery.
This script relies on the spiral.C script, also in resources/scripts.
Galleries:
1. nugen gallery
2. corsika gallery
3. coincident-muon gallery
4. IC22 filter level1 corsika gallery
5. IC22 filter level1 coincident-muon gallery
5. 'persistent' corsika gallery
6. 'persistent' coincident-muon gallery
7. 'persistent' nugen_numu gallery
8. 1-iter close, 32-iter right on nugen_numu gallery
9. 1-iter way off, 32-iter right on nugen_numu gallery
10. minbias data
11. muon filter data
12. analysis-level data
13. pbfStatus=22 gallery(failed paraboloid fits)
Click to enlarge.
More Introduction:
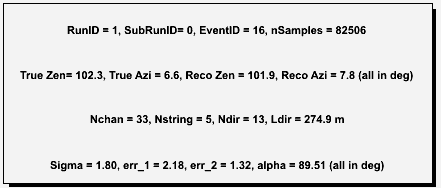
1) A good neutrino
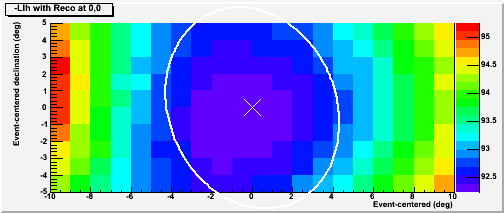
Here's an example of a good neutrino-generator event near the horizon. The white X is the reco result and the red X is the MC true direction. Check out those stats on the right.
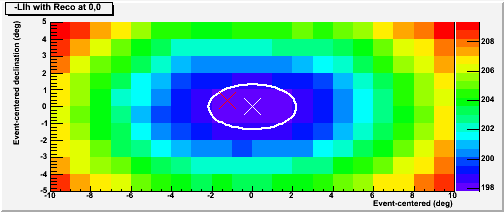
We can center the reconstructed result and zoom in to see better. Again, the white X is the reco result and the red X is the true direction, and now we can also see the paraboloid error ellipse in white.
2) A 1-string event
1-string events have flat azimuthal llh landscapes due to symmetry. So don't be too surprised if you see a map like this corsika event.
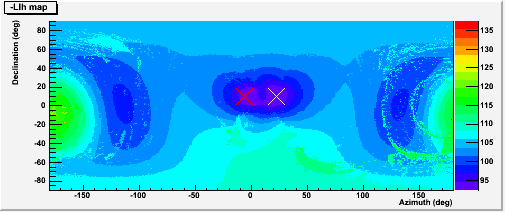
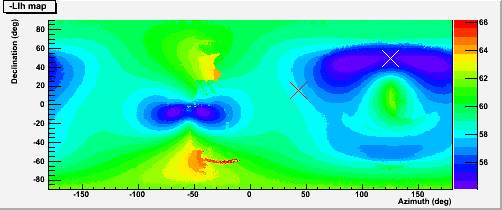
3) An event with coplanar hits
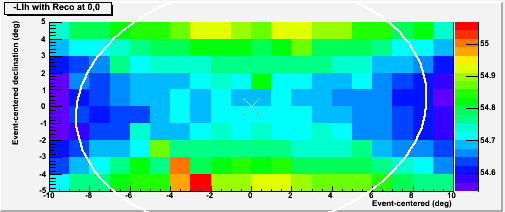
Another funny-looking event class is the case where 2 or 3 colinear strings are hit. Like in this neutrino-generator map, there is again a symmetry in azimuth. The minimizer gives one of the degenerate solutions, llh-map shows you everything.
On the right, we are zoomed in on the reconstruction. You can see that the minimizer guessed that the right-hand solution was good, but really the track came from the left-hand solution.
4) A minimizer failure
One way these llh-maps can be used is to identify peculiar events where the minimizer didn't seem to do it's job, like in this nugen event where a single-iteration llh got confused and settled on a saddle point.
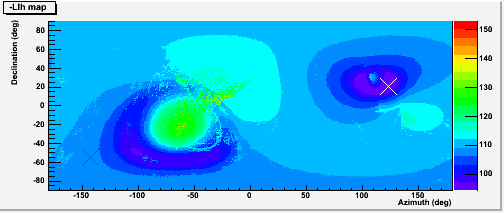
5) A coincident-muon reconstructed as upgoing
Of course, another use could be to do background rejection. This is a coincident muon that passed the level1 (linefit) filter, and an 8-iteration gulliver llh fit thought it was upgoing.
These donut-shaped llh landscapes come up often in coincident-muons when the timing just doesn't quite line up as a muon should.
The red X MC true direction is given by the most energetic muon.
Potential Uses:
There are plenty of potential uses for such a module:
1) Quality checks on reconstruction minimizer (Did it find the global min or get stuck in a local min?)
2) Paraboloid checks (Is the mc truth really within the error ellipse 50% of the time? What are the failure modes?)
3) MC checks / Likelihood function checks (Does our likelihood description of the event really have a minimum at the MC true location? Is there an energy dependence?)
4) Background rejection (This topic would need some study... e.g. Pattern recognition)
5) Use the map directly in a LLH analysis as the signal pdf.
6) Use your imagination and let me know!