Gulliver's Iterative Fitter performance on level1 MC.
The goal of this brief webpage is to determine the performance of Gulliver in rejecting background, in the context of preparing to process muon data to Level2.
Ultimately, it would be nice to see how the filter acts on signal, but we need a definition of signal, which requires a higher level of processing.
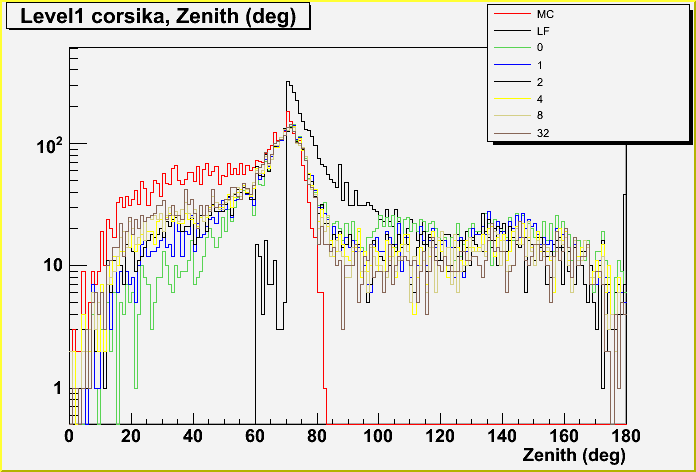
The first plots show the Zenith distributions (linear, then log) of our level1 MuonFilter corsika on the left and coincident muons on the right.
The plots show the MC, Linefit, and gulliver Zeniths.
For gulliver, we reconstruct using 0 iterations (i.e. one minimization using just the linefit seed), 1 iter (LF + one random), 2 iter, 4 iter, 8 iter, and 32 iter.
For coincident muons, the most energetic muon is plotted.
This gives you an idea of the amount of data reconstructed as upgoing vs downgoing.
To get some real numbers, look at the table below.
Table showing the fraction of level1 MuonFilter events which pass Zenith>80deg cut for linefit and various numbers of gulliver iterations.
| Reco: |
| LF |
| 0 iter |
| 1 iter |
| 2 iter |
| 4 iter |
| 8 iter |
| 32 iter |
|
| corsika: |
| 0.53 |
| 0.43 |
| 0.36 |
| 0.33 |
| 0.31 |
| 0.28 |
| 0.26 |
|
| coincident: |
| 0.83 |
| 0.77 |
| 0.75 |
| 0.73 |
| 0.70 |
| 0.66 |
| 0.55 |
|
| weighted total: |
| 0.55 |
| 0.46 |
| 0.39 |
| 0.36 |
| 0.34 |
| 0.31 |
| 0.28 |
|
We can also look at the same table but for a Zen>90 deg cut.
| Reco: |
| LF |
| 0 iter |
| 1 iter |
| 2 iter |
| 4 iter |
| 8 iter |
| 32 iter |
|
| corsika: |
| 0.40 |
| 0.37 |
| 0.31 |
| 0.29 |
| 0.27 |
| 0.24 |
| 0.23 |
|
| coincident: |
| 0.70 |
| 0.70 |
| 0.69 |
| 0.67 |
| 0.65 |
| 0.61 |
| 0.50 |
|
| weighted total: |
| 0.42 |
| 0.40 |
| 0.34 |
| 0.32 |
| 0.30 |
| 0.27 |
| 0.25 |
|
One final remark worth making is that if you do the same test over all of the level1 events, not just the MuonFilter, it essentially doesn't matter how many iterations you use, you mostly get the same fake rate.