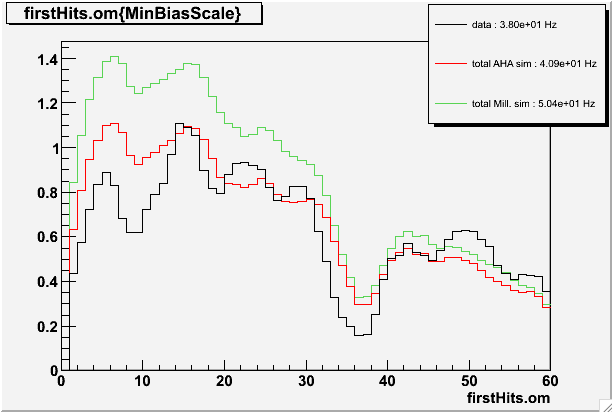
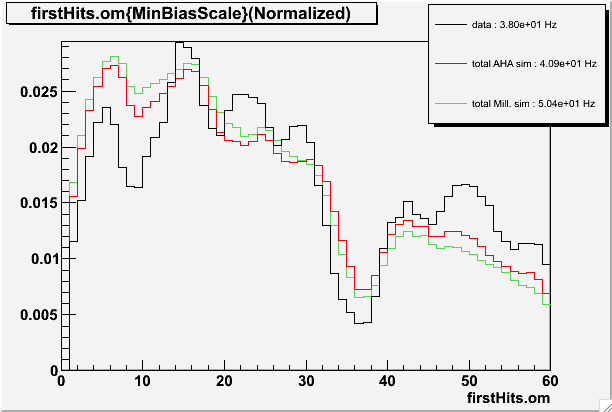
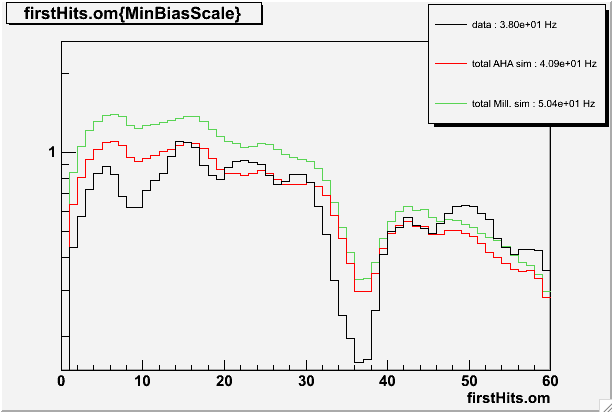
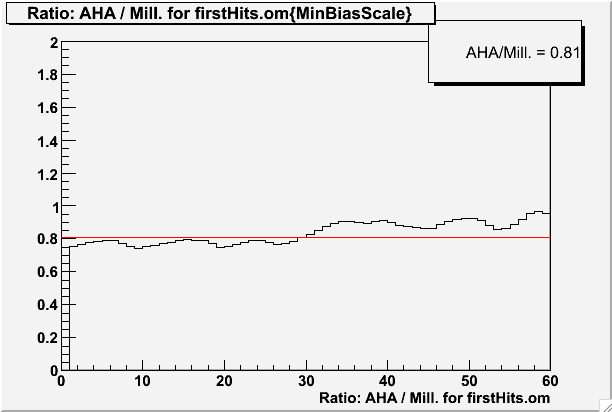
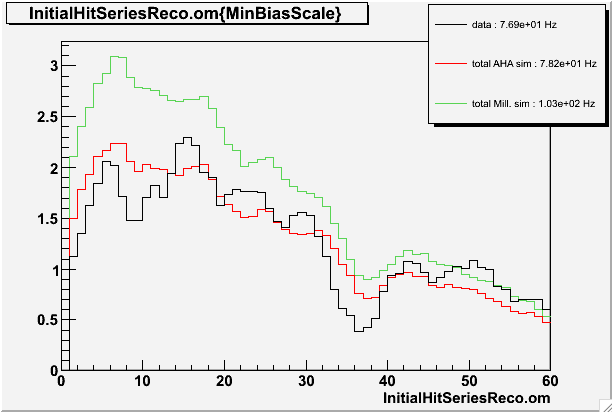
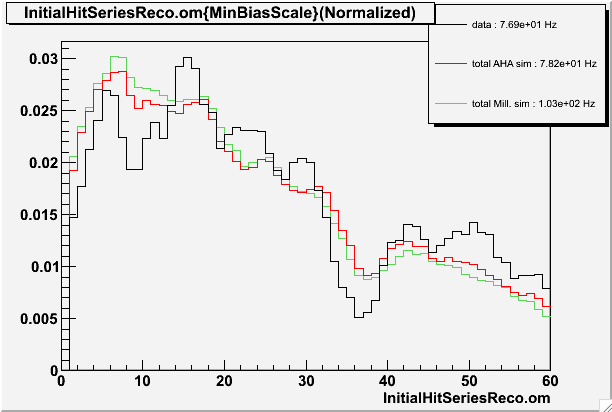
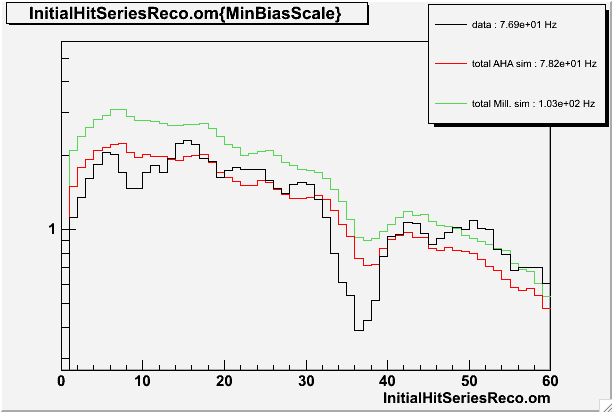
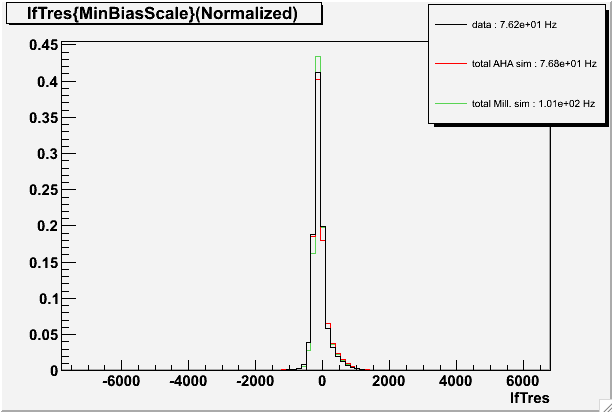
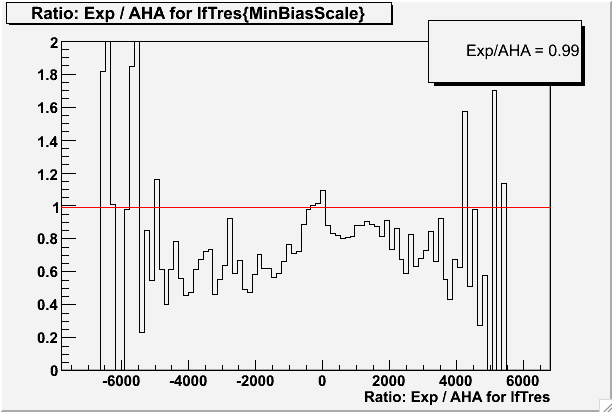
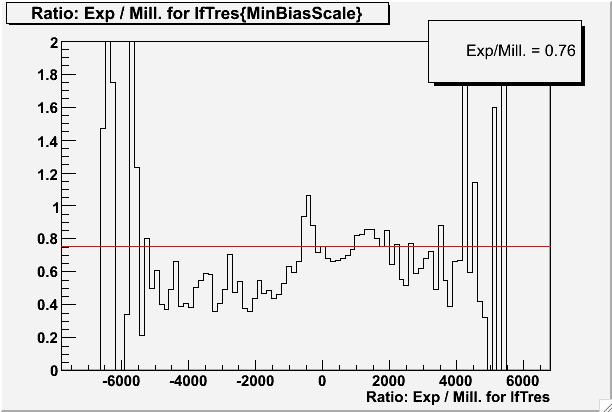
Comparing data, aha simulation, and millenium simulation.
All events are from the minbias filter or equivalently scaled by 1/200 for simulation.
Data is from almost 8 hours of run 109102 on Aug17, 2007.
I show both simulation using the aha ice model and simulation using the millenium ice model.
Both simulation sets include corsika and corsika coincident muons.
Aha datasets were 617 for corsika and 630 for coincident muons, done using IceSim-V02-00-10.
Millenium datasets were test datasets 81 for corsika and 108 for coincident muons, both using IceSIm-V02-00-07
There is one other difference between aha and millenium simulation. The DOM acceptance as a function of incident angle and wavelength have been modified.
If someone knows how much this should affect things, let me know.
The best thing is probably to make a dedicated production using new and old photonics tables.
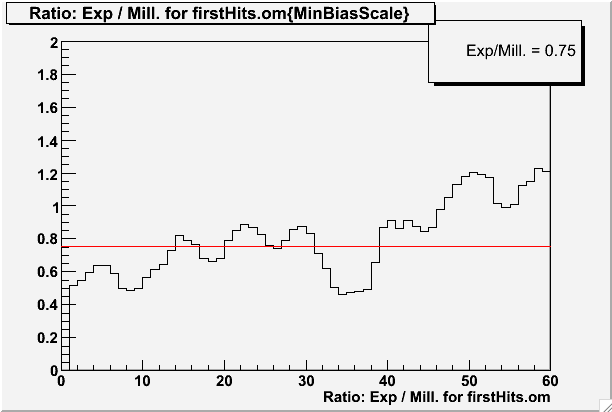
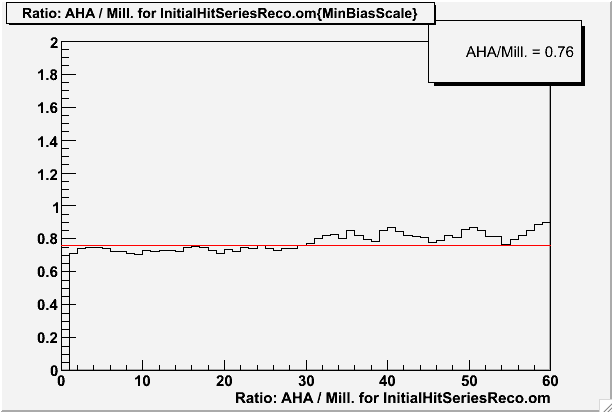
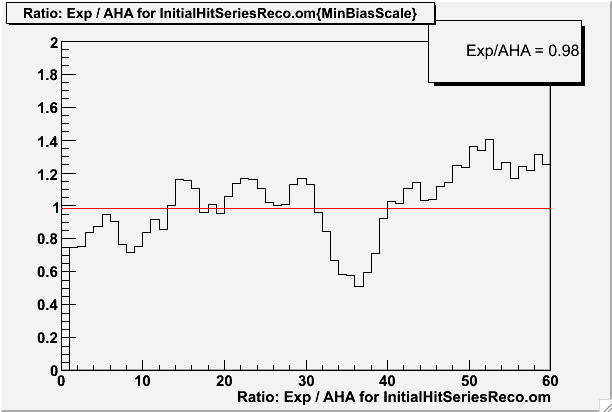
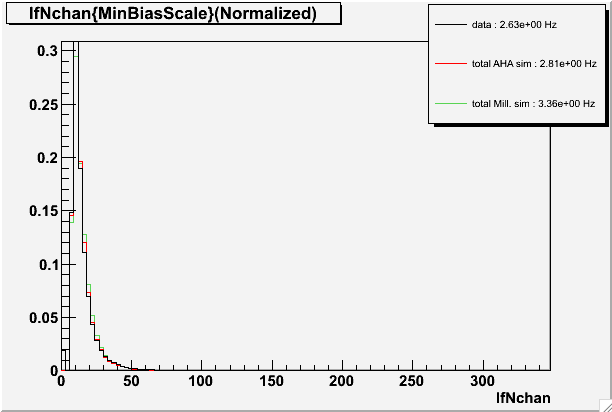
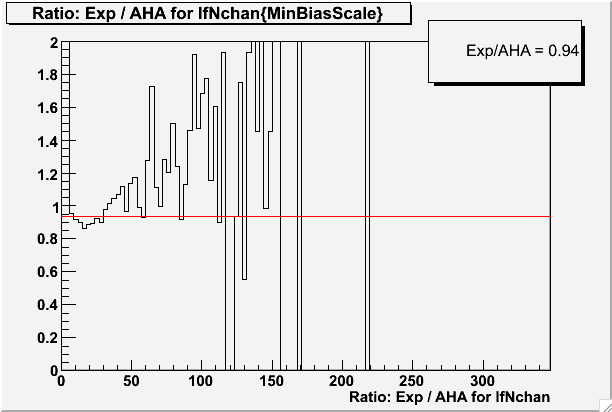
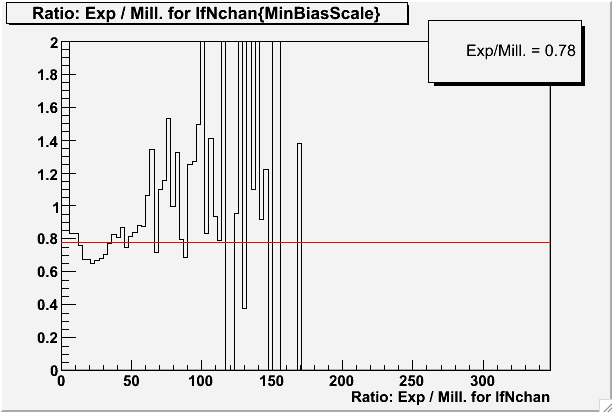
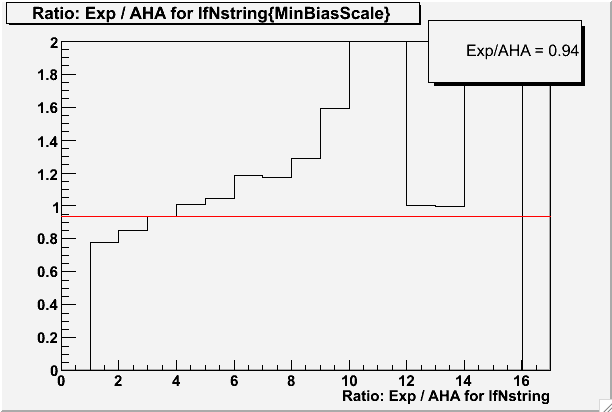
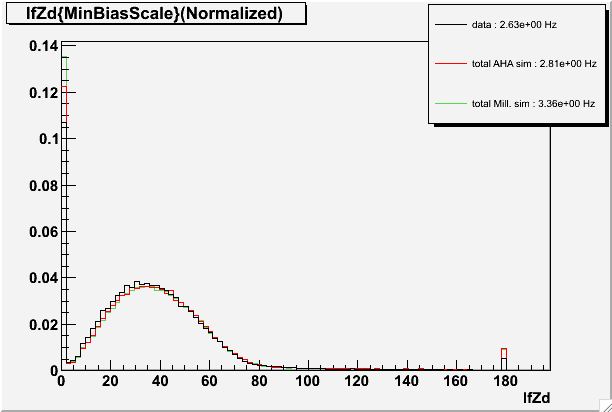
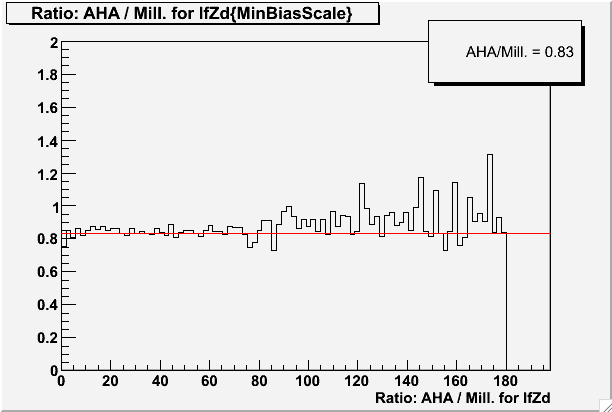
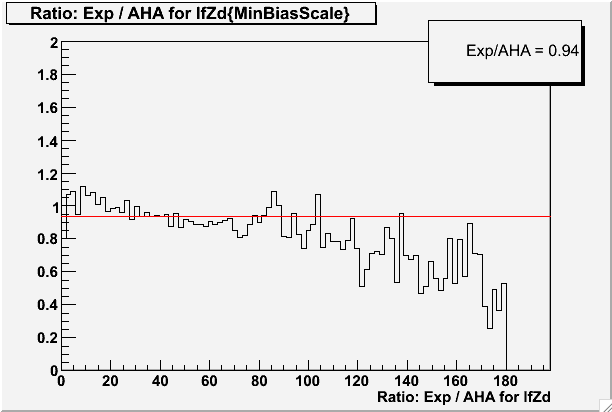
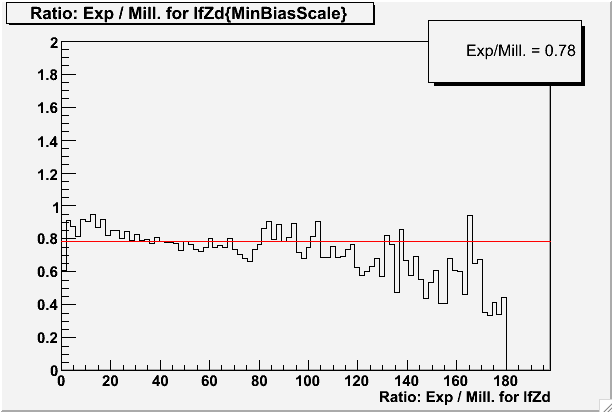
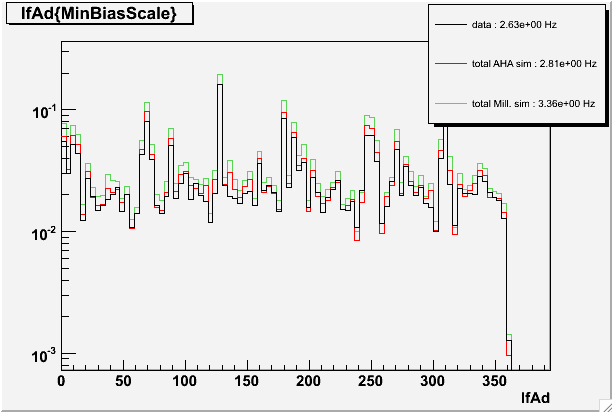
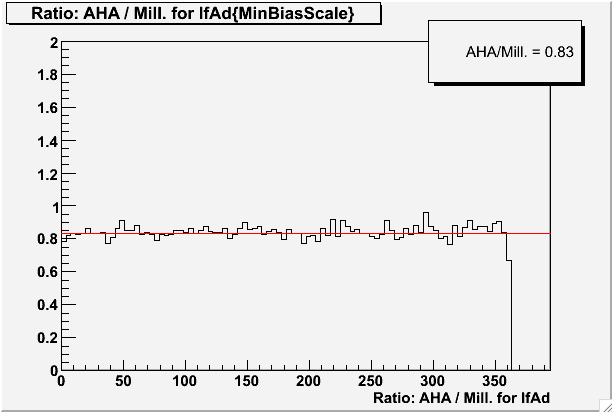
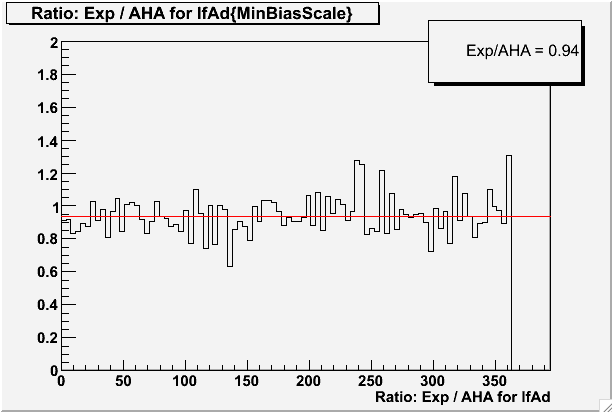
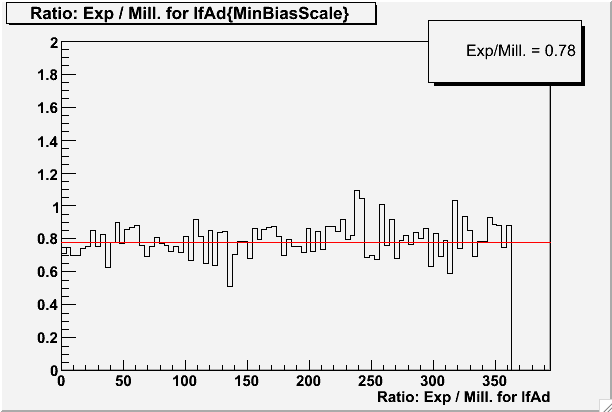
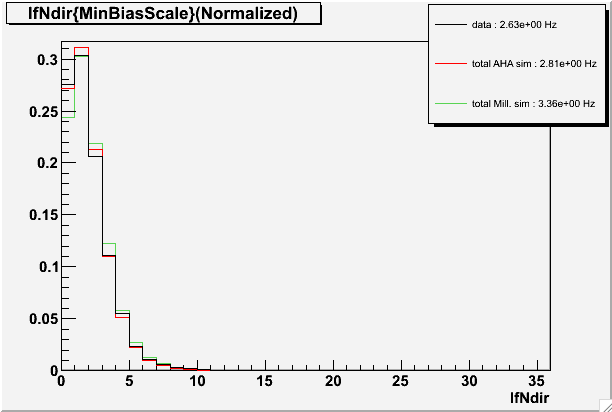
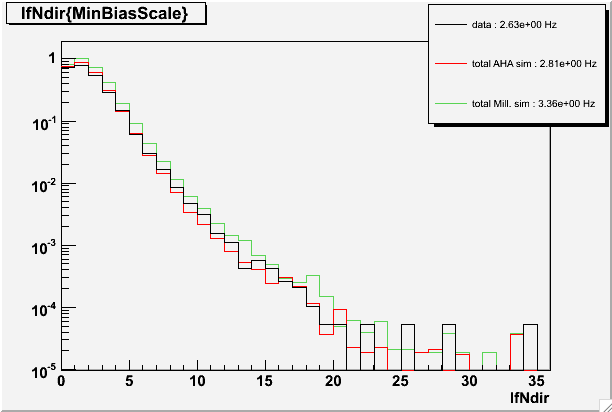
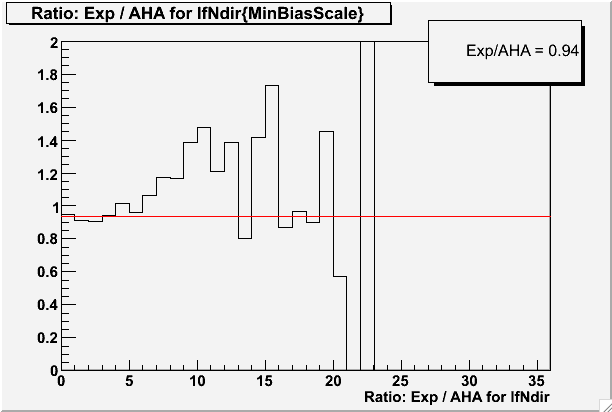
All quantities are shown with linear, normalized linear, and log scale, along with linear ratio aha/millenium, exp/aha and exp/millenium plots.
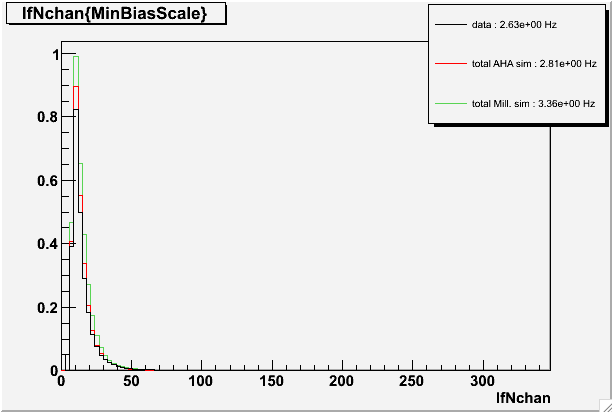
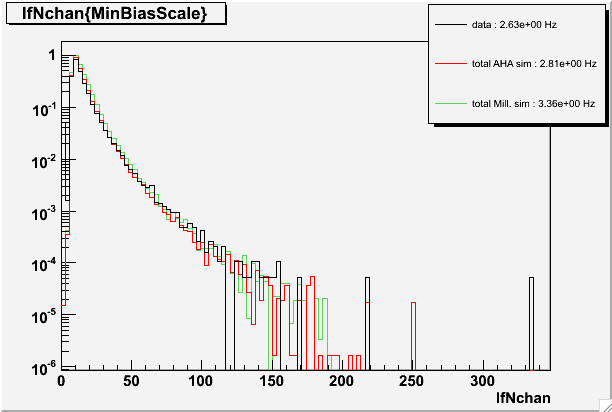
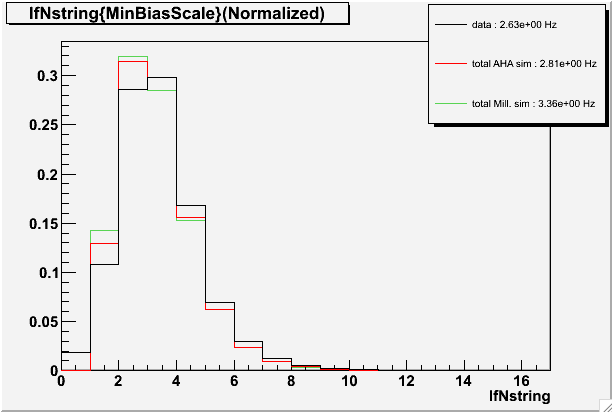
The rates shown in the legends are calculated from the quantity being plotted, so a plot of hits shows the hit rate, and a plot of Nchan (1 value per event) shows the event rate.
Please email any questions to jdumm@icecube.wisc.edu
Click to enlarge.
Plots relating to hits vs depth.
SPE DOM occupancy (hits per DOM ID)
MPE DOM occupancy (hits per DOM ID)
Plots still relating to hits but not depth.
Nchan - number of DOMs hit in event
Nstring - number of Strings hit in event
Plots relating to Reconstructions.
Linefit Zenith (deg)
Linefit Azimuth (deg)
Ndir - Number of direct (on time) hits [-15,75] ns
TimeResiduals = Actual-Expected time, given linefit and Cherenkov cone.