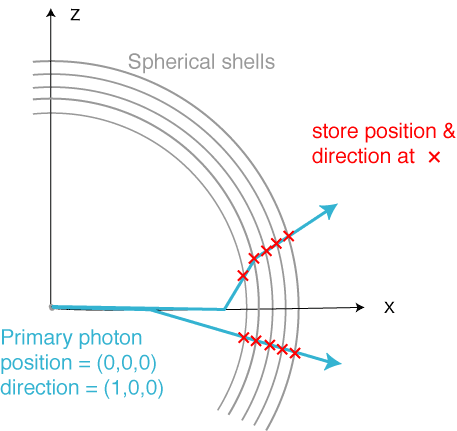
[fig1]
| Overview | How to trace
photons | How to generate table | Notation
to use
the table |
| Example plots | Programs |
Following the discussion of last EHE meeting, Shigeru, Aya and I have been
thinking about hundy raytrace simulator for flasher data. We have photonics
tables, however, it doesn't provide any information about arrival direction
of individual photons, which is one of the interesting topics for GOLDEN
DOMs.
On the other hand, we don't need to cover 1 cubic kilometer volume, actually
only a few hundred meter with one dimension(which is a distance from flasher
to receiver DOM) would be enough.
The IceRayTrace is designed especially for this purpose, with following features.
Once a photon is injected from the origin with a fixed direction (1, 0, 0),
IceRayTrace began to simulates the scattering and absorption of the photon
inside the user-defined bulk ice(for details about equations of scattering
and absorption, see Ped's Ph-D thesis). Users can save "snap shot" of
the traveling photon at any direct-distance from origin to arrival point of
photon, which is represented as a sphere inside the fig1.
The number of shells and its individual radius can be set from outside of the
module. Default number of shells are 11, radius from 100m to 150m with an interval
of 5m.

[fig1]
Taking into account of future flexibility, the primary output of IceRayTrace stores just arrays of the photons. A short root script("Plot4D.C") converts these array into TH4D histograms. The script can merge numbers of primary output into one histogram.
For injected photon, practically there are only two geometric-parameters between initial status and arrival position. Distance, opening angle(theta) between initial direction and arrival position. Incoming direction at the arrival position would be important for study of angle acceptance: then two parameter should be took into account as incoming zenith and incoming azimuth.We need yet another axis for arrival timing: most important information to distinguish direct hits.
Among these five parameters, the geometric distance
is easist to separate from others because we know exact distance between flasher
and target DOM. Therefore the
script generates one TH4D histogram per shell, then store (cos(theta),
zenith, azimuth, time) as (x, y, z, t).
Obviously, each cos(theta) bin covers different volume, then another script "Normalize.C" normalizes
the histogram with 1 / (2PI *rho) and add the normalized histogram into the
output of Plot.C.
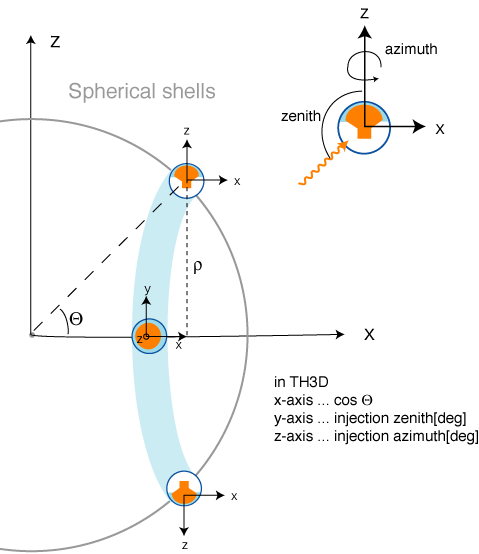
[fig2]
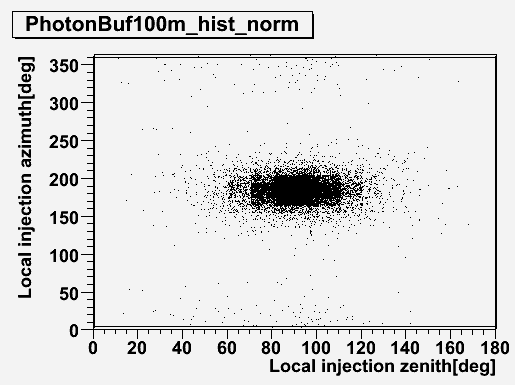
IceRayTrace provides only one-dimensional table. To save CPU time, it assumes only one fixed coordinate at arrival position. Therefore users must take care of coordinate transformation between the given coordinate and actual coordinates. Fig3 shows one example.
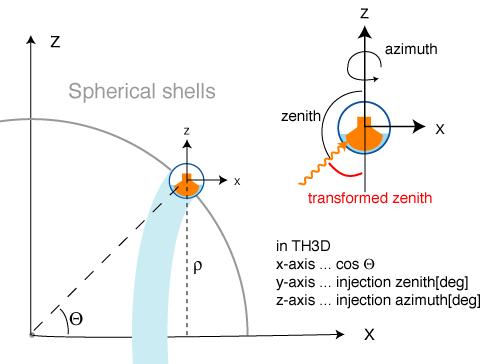
[fig3]
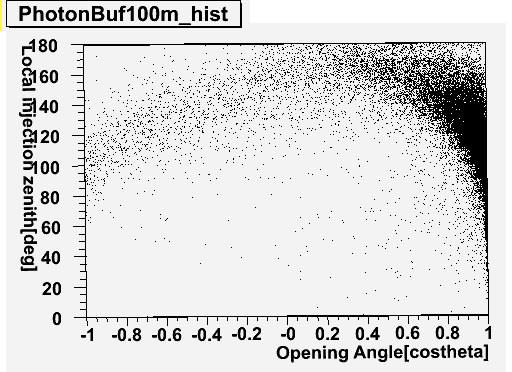
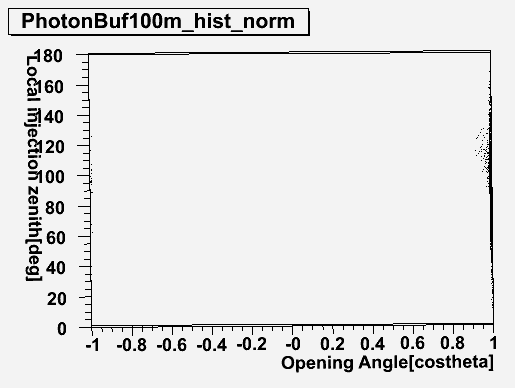
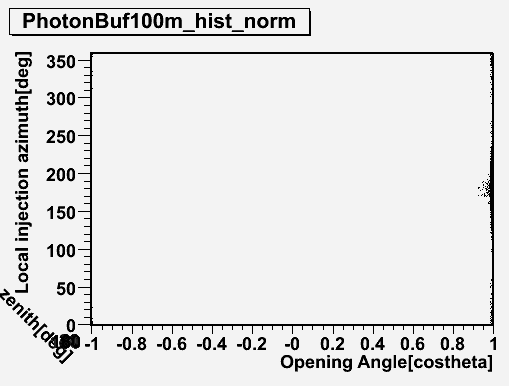
x-axis (costheta) 0.0001 (corresponds ~6m height around costheta = 1 at 125m
distance)
y-axis (zenith) 10 degree
y-axis (azimuth) 10 degree
not normalizedCluster around azimuth =0 and azimuth = 360 in CosTheta-Azimuth plots(center
row) seems to be reasonable. See run.log. |
||
 |
|
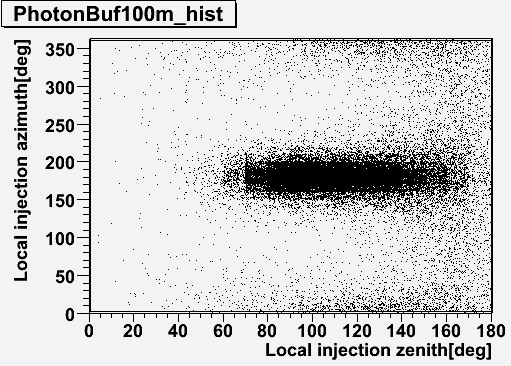 |
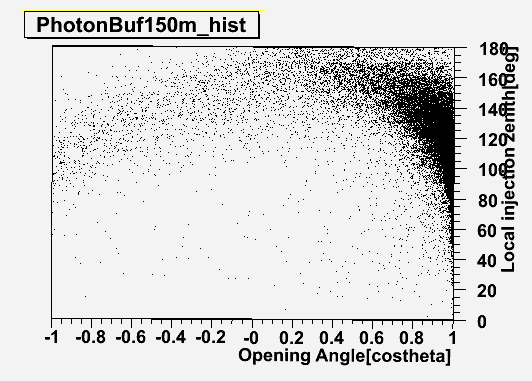 |
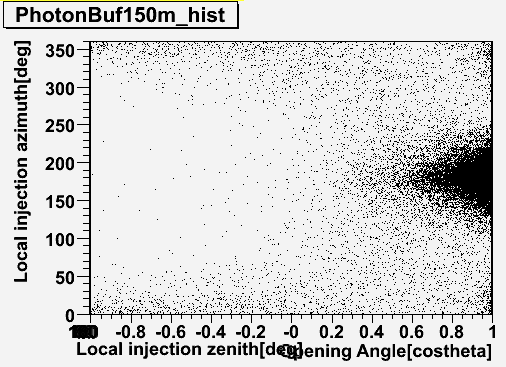 |
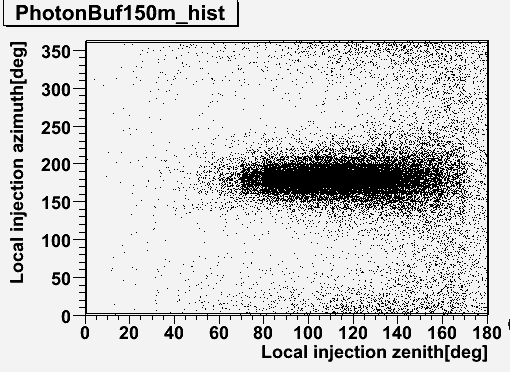 |
normalized (probability under 1.0 are not plotted...) |
||
 |
 |
 |
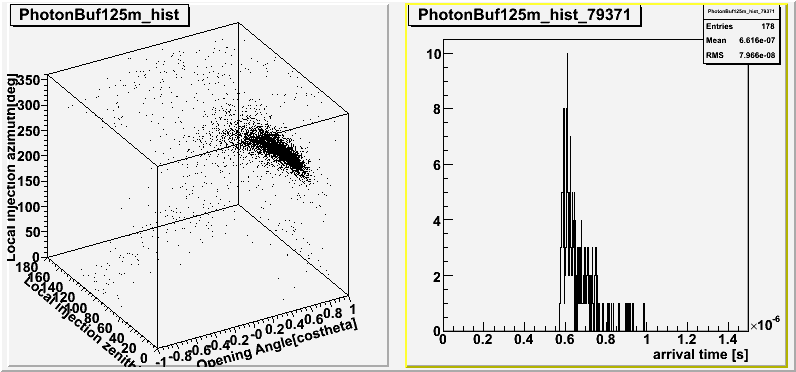
left : 3D position & direction hist
right: timing histogram arrived at
  distance = 125m
  costheta = 0.995
  injection zenith = 90 deg
  injection azimuth = 180 deg
Type
$ cd raytrace20060221/stand_alone/src
$
make install
If you are using MacOSX, you need to update gcc version 4.1.0 (to install, see here)
see README.