IceCube Tests of High Quantum Efficiency PMTs
See also the IceCube wiki page:
here
for more technical documentation and an index of presenations.
Set 1: first dump of plots
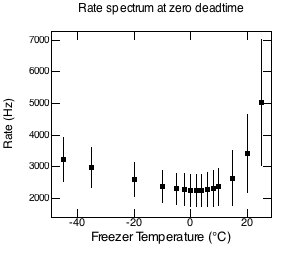
This plot shows tests on 30+ DOMs measured in the IceCube freezers at
PSL. The data sample is the dark rate, measured on each DOM each
second, using a 5-minute sample for each deadtime setting. The
zero-deadtime setting readings are shown here.
This is a default Hippodraw profile plot; i.e., for each temperature,
the point is the mean of all the dark rates measured on all the DOMs, and the error
bar is the RMS of all the dark rates.
First, noise rates are recorded in 5 minute samples for 62 doms at each of 5 deadtime
settings. This is reapeated at temperatures from +25 to -45, then
back. The freezer is geven ~8-10 hrs to equilibrate between readings.
The monitoring samples are averaged (currently a simple average, but
hope to improve it to a histogram fit, to exclude outliers better) and
plotted in Set 1:
Set 1:
A plot for each DOM, showing rate versus temp at each of the 5
deadtime settings
Then, the results for each temperature and deadtime setting are
averaged between DOMs: all doms are plotted, the resulting histogram
is fit to a gaussian, and the mean and width of the histogram are
taken as the value and error of the reading. For each deadtime
setting, those plots are shown in Set 2:
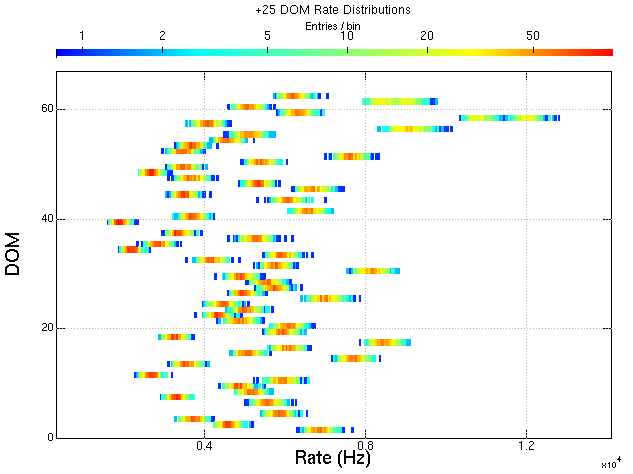
Below: a plot showing each dom (y axis) with temperature (x axis) and
distribution of rates (color/ z axis)
Sill to fill in:
Set 0:
to DOM pages
Histograms showing the spread of readings for each (dom x deadtime x temperature)
Set 2:
Histograms showing the spread of doms for each (deadtime x temperature)