Current Results for the IceCube Geometry (80 + 6).
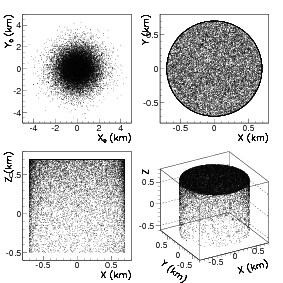
A total of 25,000 atmospheric muons were simulated.
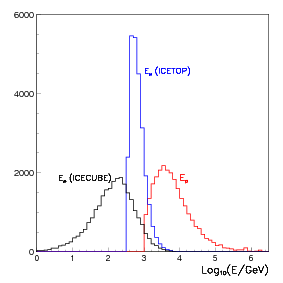
- Hit distribution and energy spectra for atmspheric muons
illuminating the IceCube detector. In the left plot, the red line
corresponds to the primary proton energy spectrum, the blue line
corresponds to the muon energy spectrum at the IceTop level and
the black line corresponds to the muon spectrum in the IceCube
detector.
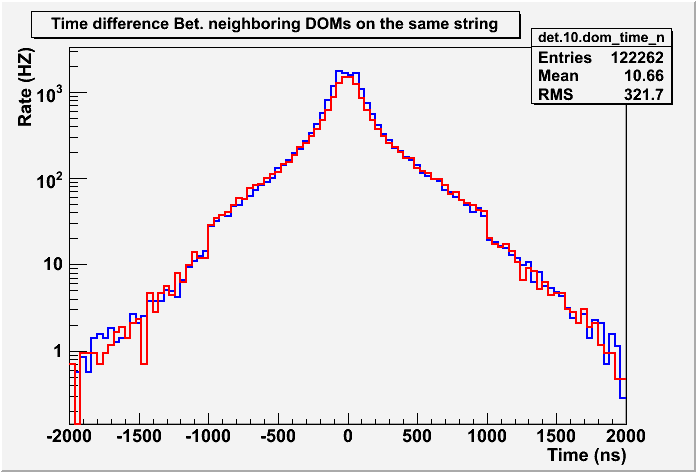
- Time distribution in ns for two adjacent DOMs on the same string. Bule is I3Geant and red is the data (left).
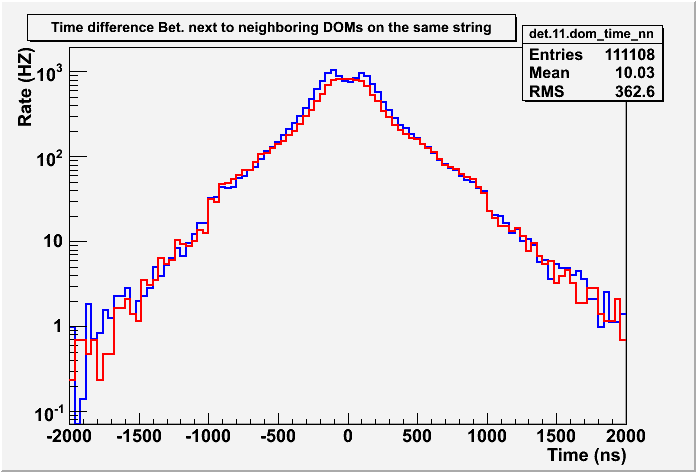
- Time distribution in ns for DOM and its next to the adjacent DOMs on the same string (right).
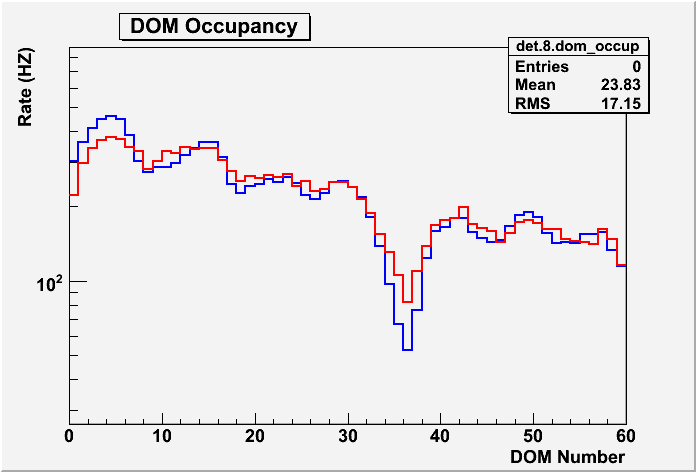
- DOM Occupancy plot for I3Geant vs the Atmospheric Muon Data for
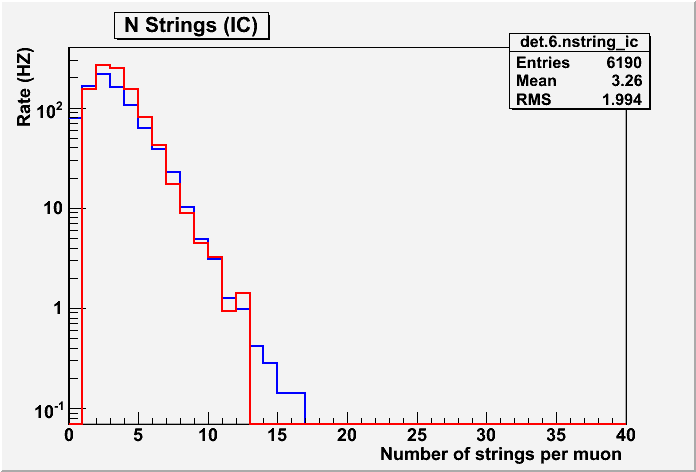
IC-40. Red is the data and blue is I3Geant (left).
- Number of strings per muon event distribution (right).
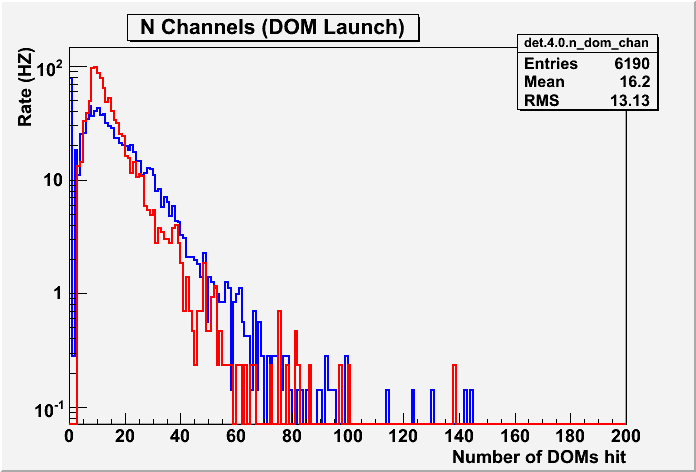
- Distrubtion of number of DOM launches per muon event. Again red is the data and blue is I3Geant.
|